Back in 2009, when Bitcoin quietly introduced the world to blockchain, few imagined the scale it would reach by 2025. Fast forward to today, and blockchain isn’t just powering cryptocurrencies; it’s transforming finance, healthcare, identity systems, and even how art is bought and sold. Its appeal? A transparent, decentralized, and tamper-resistant way to share and store data.
This shift isn’t just about technology, it’s about trust. And trust, once digitized, has massive economic implications. In 2025, we’re no longer asking if blockchain will go mainstream. The real question is: How fast is it growing, and where is it headed next?
Let’s dig into the numbers behind the revolution.
Editor’s Choice
- The global blockchain market size is expected to hit $94 billion by the end of 2025.
- Over 1.3 billion blockchain-based transactions are now processed annually across public and private networks.
- DeFi platforms collectively manage over $160 billion in total value locked (TVL) as of early 2025.
- More than 420 million blockchain wallet users are active worldwide.
- Smart contracts deployed on Ethereum and similar networks surpassed 75 million as of Q1 2025.
- U.S. blockchain startup funding reached $14.2 billion in the past 12 months.
- Tokenized assets now account for nearly $5.1 trillion in market capitalization, with real estate and equities leading the trend.
- Healthcare blockchains process over 120 million patient records.
- Asia and North America together host over 60% of active blockchain nodes, indicating strong regional infrastructure.
- The average blockchain transaction now finalizes in under 4.5 seconds.
Key Blockchain Use Cases
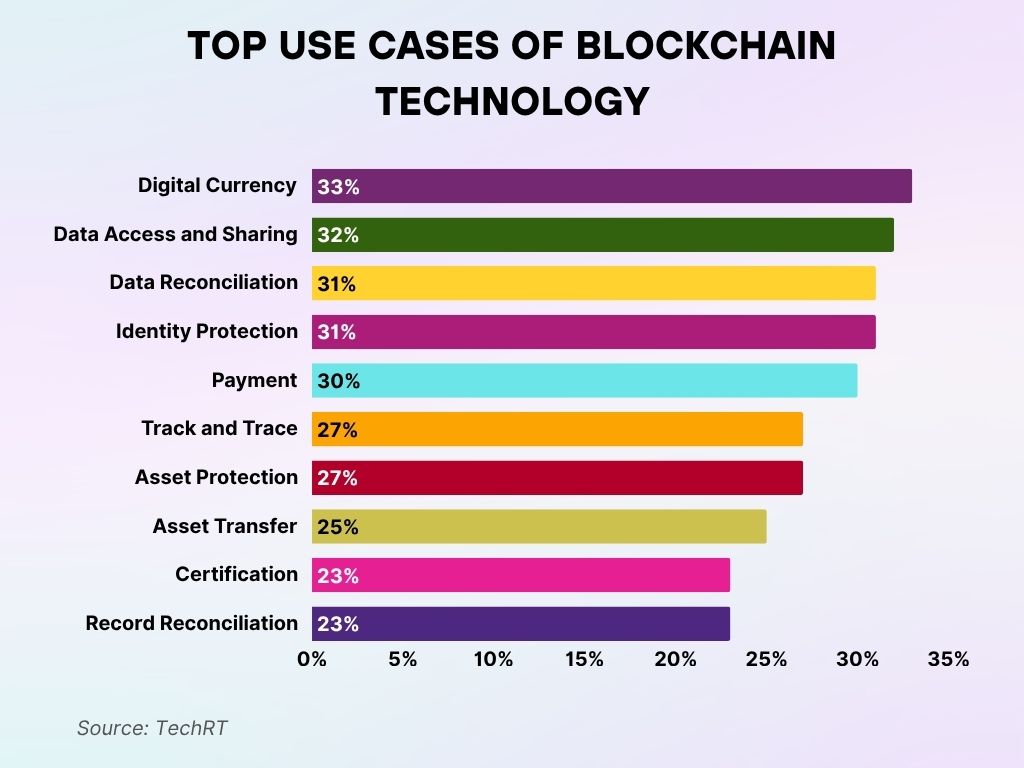
- Digital currency is the top use case, accounting for 33% of blockchain applications. It drives the core of cryptocurrencies and decentralized finance systems.
- Secure data access and sharing follow closely at 32%, showcasing blockchain’s strength in confidential and permissioned exchanges across sectors.
- Both data reconciliation and identity protection stand at 31%, underscoring the need for tamper-proof systems and privacy-focused solutions.
- Payment solutions capture 30%, reflecting blockchain’s increasing role in fast, low-cost, and borderless transactions.
- Track and trace and asset protection are tied at 27%, proving blockchain’s importance in supply chain transparency and digital asset security.
- Asset transfer accounts for 25%, driven by smart contracts and tokenization to simplify ownership transitions.
- Lastly, certification and record reconciliation each hold 23%, highlighting blockchain’s reliability in maintaining verifiable records and compliance.
Growth of Decentralized Finance (DeFi) on Blockchain
- DeFi adoption grew by nearly 22% year-over-year in early 2025.
- Over 50 million DeFi users interact with platforms like Aave, Uniswap, and Compound monthly.
- Ethereum still leads, but Layer 2 chains like Arbitrum and Optimism handle over 35% of DeFi volume.
- TVL in DeFi protocols is up by 18%, reaching $162 billion.
- Staking services saw a 25% increase, now managing over $68 billion in assets.
- Decentralized exchanges (DEXs) processed more than $120 billion in monthly trade volume in 2025.
- DeFi lending platforms have loaned out $42 billion year-to-date.
- Stablecoin usage in DeFi accounts for over 40% of total volume, with USDC and USDT maintaining dominance.
- More than 70% of DeFi transactions are now processed through mobile apps.
- Regulated DeFi (RegFi) platforms are emerging, accounting for nearly 5% of total TVL, signaling increased institutional entry.
Blockchain Transactions Volume by Network
- Ethereum leads with over 1.1 million transactions per day as of Q2 2025.
- Solana surpassed 450 million monthly transactions, driven by its growing DeFi and NFT ecosystems.
- Polygon processes over 3 million transactions daily, making it the most active Layer 2 network.
- Bitcoin’s network averages about 350,000 daily transactions, showing steady non-DeFi activity.
- BNB Chain clocks over 2.4 million daily transactions, maintaining its rank in high-throughput performance.
- Arbitrum and Optimism together now exceed 1.8 million daily transactions, up 20% year-over-year.
- Avalanche and Fantom show moderate growth, jointly accounting for over 500,000 daily transactions.
- Ripple (XRP Ledger) facilitates over 100 million transactions quarterly, mostly cross-border payments.
- StarkNet and zkSync Era, newer zero-knowledge networks, process a combined 1.2 million transactions daily.
- Blockchain interoperability hubs like Cosmos and Polkadot together facilitate over 650,000 cross-chain transfers per month.
Leading Crypto Exchanges by 30-Day Trading Volume
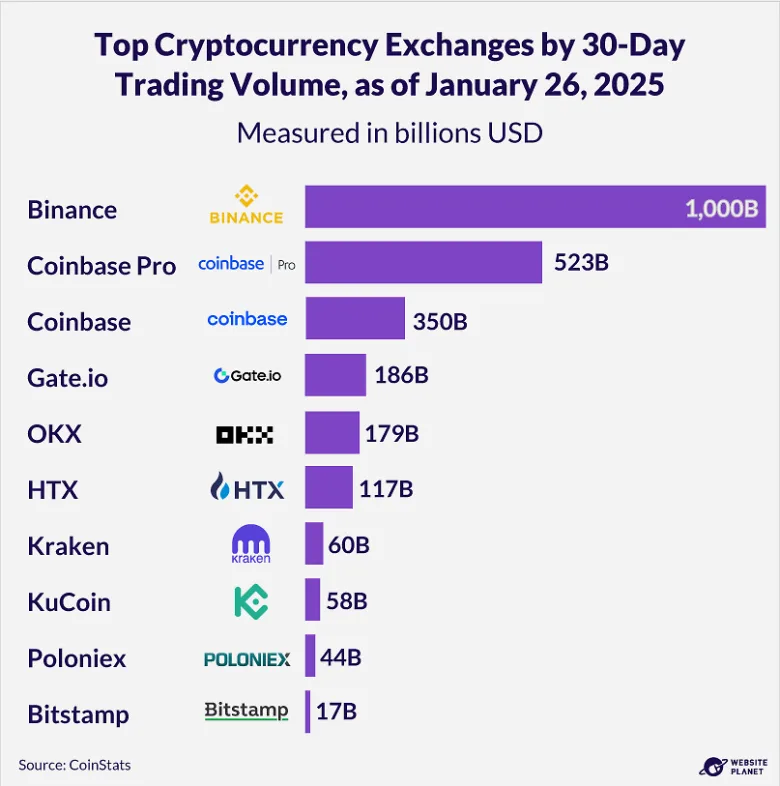
- Binance dominates the scene with a staggering $1,000B in trading volume, firmly holding its spot as the global market leader.
- Coinbase Pro secures second place at $523B, fueled by institutional investors and high-volume trading.
- The core Coinbase platform follows with $350B, powered by rising adoption among U.S. retail users.
- Gate.io and OKX report $186B and $179B, respectively, reflecting strong performance in Asia and emerging markets.
- HTX (formerly Huobi) processed $117B, maintaining steady user flow despite ongoing regulatory scrutiny.
- Kraken and KuCoin show solid activity with $60B and $58B, catering to altcoin enthusiasts and seasoned traders.
- Poloniex and Bitstamp round out the list with $44B and $17B, proving their value in niche markets and long-time user loyalty.
Smart Contracts Deployment Trends
- Over 75 million smart contracts were deployed across public blockchains as of mid-2025.
- Ethereum hosts 62% of all live smart contracts, though its share is declining due to rising competition.
- Solana and Binance Smart Chain saw the largest year-over-year increase in contract deployments, up 38% and 29% respectively.
- About 43% of smart contracts are related to DeFi protocols.
- NFT-related contracts make up 15% of all deployments.
- Smart contract security audits grew by 47%, reflecting increased awareness of code risk.
- Automated contract deployment tools are now used in over 60% of new blockchain projects.
- Enterprise smart contract use grew by 24%, especially in logistics, insurance, and data validation.
- Contract renewal and self-destruction rates indicate that only 60% of contracts remain active beyond 6 months.
- On-chain contract interactions now account for over 70% of gas fees on high-usage networks.
Geographic Distribution of Blockchain Nodes
- The United States hosts approximately 25% of all active blockchain nodes globally in 2025, maintaining its lead from the previous year.
- Germany and the Netherlands collectively host about 14% of Ethereum nodes, making Europe a strong decentralization hub.
- China’s share of public blockchain nodes dropped to under 4%, largely due to regulatory pressures.
- India now ranks in the top five globally, with 6.3% of nodes.
- Brazil and Nigeria have seen node growth of 35% and 41%, respectively, reflecting expanding adoption in emerging markets.
- Asia-Pacific overall accounts for nearly 30% of global node infrastructure, with contributions from Japan, South Korea, and Singapore.
- Africa’s total node count grew by over 60% year-over-year, though the continent still holds less than 2% of the global total.
- Node uptime now averages 99.92%, due to better decentralized hosting and monitoring tools.
- IPFS and Filecoin nodes surged by 70%, signaling the rise of decentralized storage alongside traditional chains.
- More than 40% of nodes are now cloud-hosted, predominantly on platforms like AWS and Google Cloud, despite decentralization debates.
Blockchain Market Value by Sector
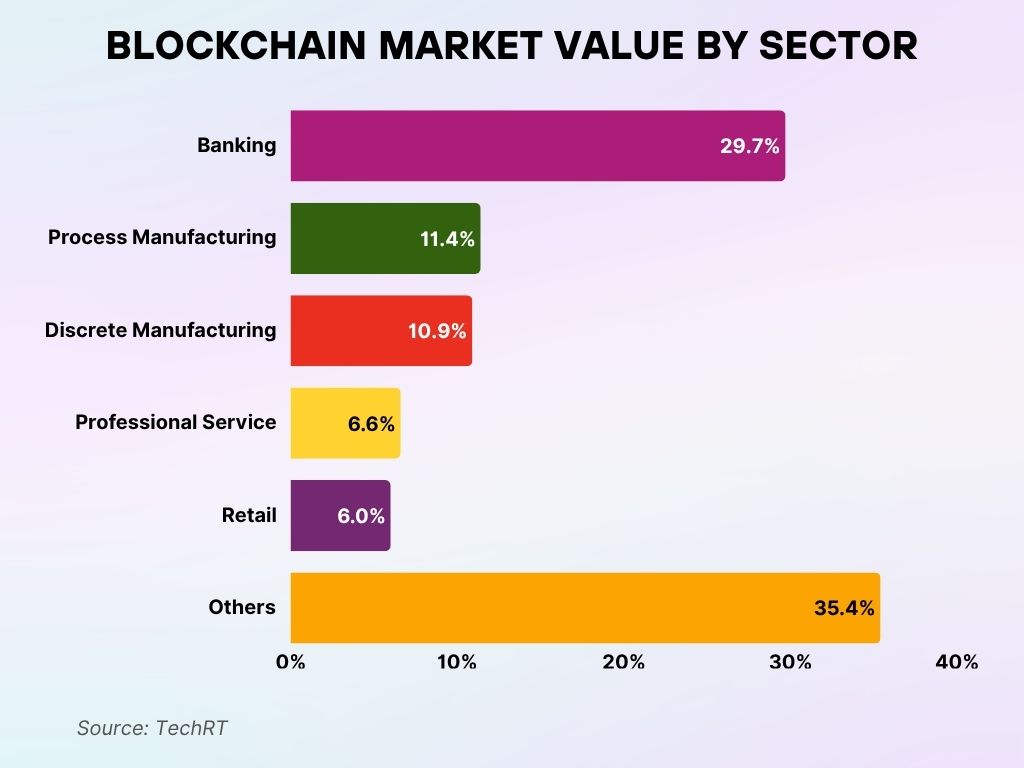
- Banking leads the charge with a 29.7% share, underscoring its pivotal role in decentralized finance, secure payments, and ledger-based systems.
- Process manufacturing claims 11.4%, tapping into blockchain for supply chain visibility and real-time production insights.
- Discrete manufacturing holds 10.9%, driven by the need for part traceability and quality control in complex production environments.
- Professional services represent 6.6%, using blockchain for smart contracts, digital identity, and legal tech transformation.
- Retail contributes 6%, utilizing blockchain to boost inventory tracking, fraud prevention, and consumer confidence.
- The “Others” segment stands largest at 35.4%, pointing to blockchain’s rapid expansion into healthcare, public sector, logistics, and more.
Blockchain Startups and Funding Trends
- Blockchain startups raised $22.8 billion globally in funding during the last 12 months.
- North America accounts for 49% of all funding rounds, particularly in DeFi, AI-chain integrations, and tokenization.
- Seed and Series A rounds dominate, representing 61% of total deals, highlighting early-stage activity.
- Over 3,100 new blockchain startups were launched in 2024 alone, with growth continuing into 2025.
- Enterprise blockchain solutions saw a funding uptick of 28%, especially in the supply chain and identity sectors.
- Women-led blockchain startups received only 3.6% of total capital, underlining a persistent gender funding gap.
- Web3 gaming and metaverse-focused projects attracted $5.4 billion in new investment, despite a cooldown in user activity.
- Decentralized social media platforms raised more than $900 million, showing early traction.
- AI-integrated blockchains received over $3.3 billion, reflecting the convergence of two emerging technologies.
- The average blockchain startup valuation rose to $42 million.
Tokenization of Assets via Blockchain
- Tokenized real estate hit a global market cap of $830 billion, with the U.S. accounting for over 40%.
- Equity tokens now represent $1.1 trillion in combined market value, reflecting increased investor confidence.
- Tokenized U.S. Treasury bills surged to over $350 billion, led by institutional DeFi protocols.
- Commodities tokenization (gold, oil, carbon credits) saw 28% growth year-over-year, reaching $240 billion.
- Fractionalized NFTs for art and collectibles hold a combined value of $19.5 billion in 2025.
- Private credit and real-world asset (RWA) tokens are gaining traction, now worth over $52 billion.
- More than 180 banks now offer tokenization services or pilot programs.
- Token issuance platforms like Securitize and Polymath processed over 2,600 deals in 2024–2025.
- Real estate investment via blockchain is up 22% year-over-year, with increasing participation from retail investors.
- Tokenized assets on public blockchains are now preferred over private chains for their transparency and accessibility.
Global Leaders in Blockchain Patent Filings
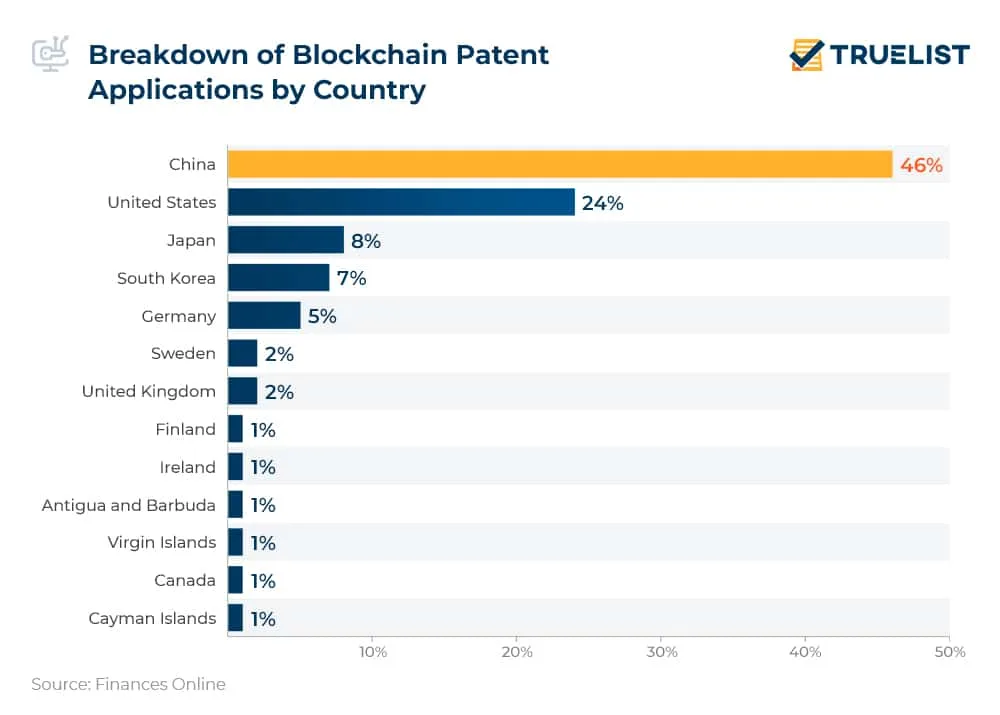
- China is at the forefront, responsible for a commanding 46% of all blockchain patent applications, nearly twice that of any other country.
- The United States takes second place with 24%, reflecting a strong drive to protect blockchain innovations and intellectual property.
- Japan contributes 8%, fueled by advancements in fintech and blockchain-integrated automation.
- South Korea follows with 7%, leveraging its tech-savvy market and growing use of blockchain in gaming and financial platforms.
- Germany holds a 5% share, focused on applying blockchain to manufacturing, logistics, and Industry 4.0 initiatives.
- Sweden and the United Kingdom each account for 2%, signaling active roles in the global blockchain race.
- Smaller players like Finland, Ireland, and jurisdictions such as the Cayman Islands and Virgin Islands each contribute 1%, proving that innovation in blockchain spans the entire globe.
Blockchain in Healthcare and Identity Verification
- Over 120 million medical records are secured on blockchain-based systems globally.
- Electronic Health Records (EHR) blockchains saw adoption from 15 new hospital networks in the US alone.
- Identity verification platforms using blockchain now serve over 350 million users, especially in banking and e-commerce.
- Over 75 blockchain health-tech startups have launched in the past year, showing high investor interest.
- Blockchain-based vaccination records are live in 18 countries, streamlining verification for travel and education.
- Insurance claims processed on blockchain average a 30% faster turnaround time compared to traditional systems.
- Healthcare fraud detection using blockchain saved an estimated $2.6 billion globally.
- Decentralized identity (DID) wallets are now supported by over 200 institutions, including universities and credit agencies.
- HIPAA-compliant blockchain systems now account for 70% of US blockchain healthcare solutions.
- Cross-border patient data transfers using blockchain tech increased by 48%, simplifying continuity of care.
Impact of Blockchain on Traditional Banking
- 82% of major banks globally have initiated or completed blockchain pilot programs as of 2025.
- JPMorgan’s Onyx blockchain network processed over $3.5 trillion in transactions in the past year alone.
- Blockchain-based settlements cut costs by up to 60% for cross-border transactions, according to recent industry benchmarks.
- CBDCs (Central Bank Digital Currencies) are in pilot or live phases in over 35 countries, most using blockchain frameworks.
- Smart contract-driven syndicated lending now represents $90 billion in volume, streamlining compliance and documentation.
- SWIFT integration with blockchain networks is now live with over 130 partner banks.
- Blockchain-enabled Know Your Customer (KYC) systems reduce onboarding times by 42% on average.
- Bank-issued stablecoins such as JPM Coin and Euro Coin gained over $15 billion in circulation combined.
- Tokenized deposit products offered by banks grew by 80% year-over-year, serving institutional clients.
- More than 70% of banking executives believe blockchain will be critical to core banking systems within the next 5 years.
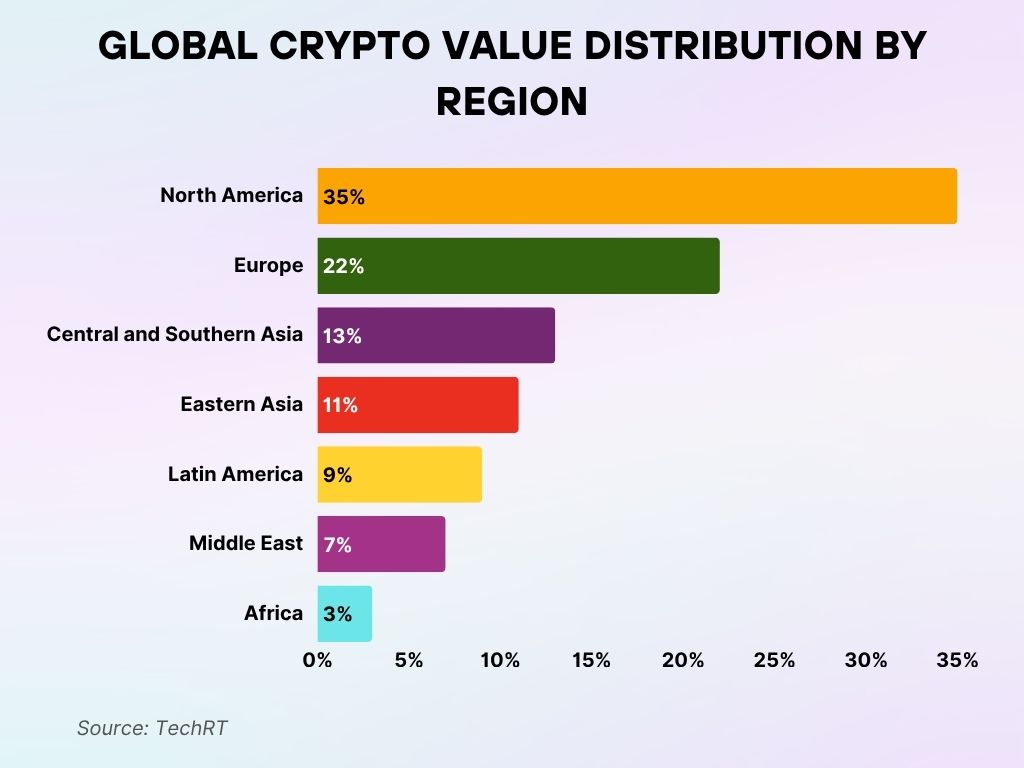
Regional Breakdown of Global Crypto Value Received
- North America leads with a dominant 35% share, driven by institutional giants, active retail investors, and a mature crypto ecosystem.
- Europe takes second place with 22%, boosted by regulatory clarity, fintech innovation, and blockchain-forward policies.
- Central and Southern Asia account for 13%, showing explosive growth fueled by mobile-first adoption and emerging market demand.
- Eastern Asia holds 11%, supported by high trading activity and advanced tech infrastructure, despite regulatory challenges.
- Latin America contributes 9%, where crypto is increasingly used for remittances, hedging against inflation, and financial inclusion.
- The Middle East secures 7%, reflecting rising interest in blockchain-powered logistics and state-supported crypto projects.
- Africa holds a modest 3%, but stands out as a fast-growing region utilizing crypto for cross-border payments and financial access in underserved areas.
Blockchain Network Congestion and Scalability
- Ethereum gas fees averaged $2.40 per transaction in 2025, down 35% from early 2024, thanks to Layer 2 scaling.
- Solana’s average block time is now under 400 milliseconds, maintaining its lead in network speed.
- Polygon’s zkEVM processed over 25 million transactions monthly, with near-zero gas fees for users.
- Network congestion events dropped by 41% year-over-year, showing progress in infrastructure resilience.
- Optimistic rollups and zk-rollups now process over 55% of Ethereum’s total transactions, reducing L1 pressure.
- Throughput on Avalanche subnets grew to 4,500 TPS (transactions per second), used mainly in DeFi and gaming.
- Binance Smart Chain (BSC) reached 3 million daily transactions, but faced scaling debates over centralization.
- Arbitrum One’s TVL increased to $18.2 billion, making it the most adopted Ethereum scaling solution.
- Cross-chain bridges now handle $1.2 billion in weekly volume, though security remains a concern.
- Node sync times have decreased by 20% across major networks due to more efficient consensus and data pruning.
User Demographics in Blockchain Ecosystems
- There are now 420+ million blockchain wallet users globally, with over 110 million in the United States.
- Millennials and Gen Z make up 68% of active crypto and blockchain users, primarily on mobile platforms.
- Women represent 28% of blockchain users, indicating an improvement in gender inclusivity.
- Over 53% of users access blockchain services via mobile devices.
- Latin America and Southeast Asia saw user growth of 34% and 29%, respectively, driven by remittance and gaming use cases.
- Blockchain education enrollment in online platforms grew by 61%, reflecting rising public interest.
- Small business blockchain adoption in the US increased to 18%, especially for payments and loyalty programs.
- Daily active users (DAUs) on Web3 platforms now exceed 5.7 million globally, led by DeFi, NFTs, and gaming dApps.
- Crypto usage for remittances saw 19% growth in 2025, with the Philippines, Nigeria, and Mexico leading the trend.
- KYC-compliant wallets now represent over 60% of blockchain activity, aligning with global regulatory efforts.
Blockchain Market Growth: What’s Ahead
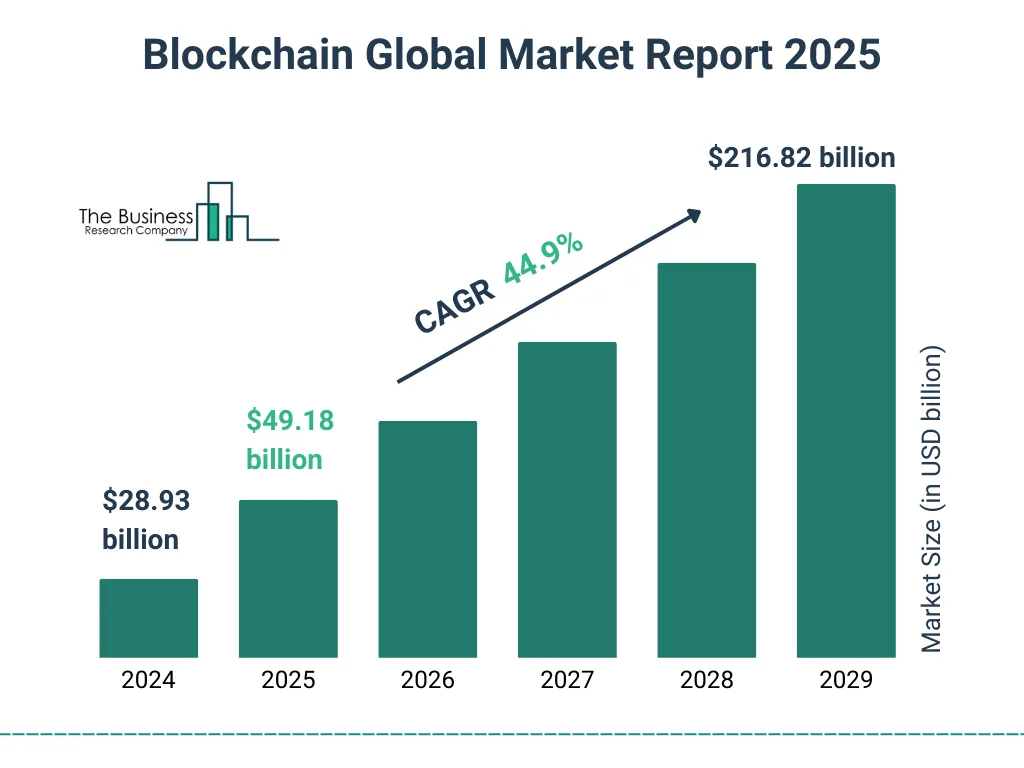
- The global blockchain market is on track to surge from $28.93 billion (2024) to a massive $216.82 billion by 2029.
- By 2025, it’s expected to hit $49.18 billion, thanks to rising adoption in finance, supply chain management, and digital identity solutions.
- With a projected CAGR of 44.9%, blockchain is no longer just hype — it’s becoming a foundational technology.
- This explosive growth reflects strong enterprise investment, supportive regulatory trends, and real-world utility, accelerating blockchain’s global integration.
Recent Developments in Blockchain Technology
- Zero-knowledge (ZK) technology became the dominant narrative in 2025, with zkSync Era and StarkNet driving adoption.
- Modular blockchain architecture is gaining traction, separating execution, consensus, and data availability layers for scalability.
- Account abstraction is now live on Ethereum, simplifying wallet usability and recovery.
- Bitcoin Ordinals continue to expand beyond NFTs, enabling new use cases like decentralized identity and metadata storage.
- Interoperability protocols like LayerZero and Axelar are being adopted by over 60 dApps, making cross-chain usage more seamless.
- On-chain AI agents are emerging, automating transactions and governance decisions based on user preferences.
- Green blockchain initiatives reduced carbon impact by 37%, led by protocols using proof-of-stake and carbon offsetting.
- Decentralized physical infrastructure networks (DePINs) gained visibility, with use cases in storage, compute, and telecom.
- Web3 social media platforms like Farcaster and Lens Protocol gained over 1 million active users combined.
- Governance participation in DAOs rose by 24%, with voters becoming more educated and engaged in treasury decisions.
Conclusion
Blockchain technology has officially passed the novelty phase. By mid-2025, it’s clear that blockchain is a foundational infrastructure, not a speculative experiment. Across industries, from banking and real estate to healthcare and identity, real-world use cases are proving durable, secure, and scalable.
We’ve seen growth in almost every corner: DeFi ecosystems expanding, smart contract adoption booming, and scaling technologies solving congestion problems. But what’s most exciting is the shift in who’s using blockchain and how, more people, more institutions, more nations are betting on the technology.
As regulations mature and user experience improves, blockchain’s path into the mainstream seems more assured than ever. The numbers in 2025 tell a clear story: The future isn’t coming, it’s already running on-chain.


Leave a comment
Have something to say about this article? Add your comment and start the discussion.