It started with a buzz, quite literally. The first mobile phones were bulky bricks that barely fit in a briefcase. Fast forward to today, and smartphones have become digital lifelines. Whether it’s ordering groceries, joining a video meeting, or tracking health metrics, our phones have become an extension of us. As we enter 2025, the global smartphone landscape is shifting rapidly, powered by AI, affordability, and always-on connectivity. This article will unpack the latest data, behaviors, and trends that define how we use, buy, and depend on our smartphones.
Editor’s Choice
- Global smartphone penetration has reached 79.5% in 2025.
- Over 6.6 billion people now own smartphones, marking a 3.1% increase year-over-year.
- In the United States, smartphone ownership surpassed 91%, a record high.
- The average time spent on smartphones daily is now 4.6 hours.
- AI-integrated smartphones account for 52% of all new device shipments globally in 2025.
- 5G smartphone adoption hit 74% worldwide, driven by price drops and infrastructure expansion.
- Global smartphone shipments rebounded to 1.35 billion units after a slight dip in 2023.
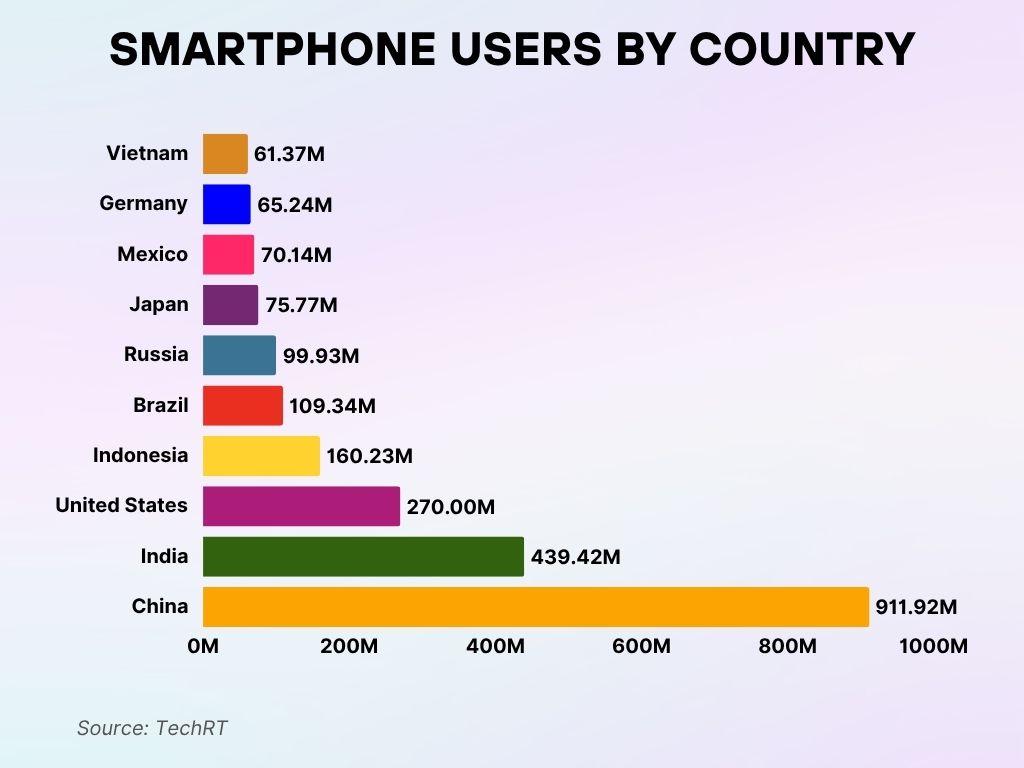
Smartphone Users by Country
- Vietnam is home to 61.37 million smartphone users, reflecting growing digital adoption in Southeast Asia.
- Germany counts 65.24 million users, marking a mature and saturated mobile market.
- Mexico has reached 70.14 million smartphone users, driven by rising mobile internet access.
- Japan reports 75.77 million users, showcasing its tech-savvy population.
- Russia has a sizable 99.93 million smartphone user base, spanning vast geographic regions.
- Brazil has surged to 109.34 million users, supported by its vibrant e-commerce and social media activity.
- Indonesia shows rapid growth with 160.23 million smartphone users, fueled by a mobile-first economy.
- The United States stands strong with 270 million users, reflecting near-universal smartphone penetration.
- India boasts a staggering 439.42 million users, one of the largest mobile markets globally.
- China dominates with an unmatched 911.92 million smartphone users, cementing its position as the world leader.
Mobile Phone Ownership Over Time
- In 2011, only 35% of adults in the US owned a smartphone. By 2025, that figure has climbed to 91%.
- The global smartphone ownership rate grew from 61% in 2018 to 79.5% in 2025.
- Asia-Pacific leads in growth, with ownership climbing from 58% in 2020 to 81% in 2025.
- Among people aged 18–29, smartphone ownership is nearly universal at 98% in 2025.
- Rural smartphone ownership in the US reached 85%, narrowing the urban-rural tech divide.
- Older adults (65+) in the US now show 75% smartphone adoption.
- In Africa, smartphone penetration has reached 49%, driven by mid-range Android devices.
- Among Gen Z globally, 96% own a smartphone, with over 70% using it as their primary computing device.
- The average number of smartphones per household in the US stands at 2.8 in 2025.
- In emerging markets, low-cost smartphone initiatives boosted ownership by 11% YoY.
Smartphone Dependency Over Time
- In 2025, 72% of users globally say they “can’t live without” their smartphones.
- The average screen unlocks per day hit 96.
- 57% of US adults check their smartphones within 5 minutes of waking up.
- Over 42% of smartphone users experience nomophobia—the fear of being without their phone.
- The average person receives 88 notifications per day in 2025.
- Smartphone usage among teens (13–17) now exceeds 5.2 hours daily.
- In the workplace, 46% of employees report checking work emails outside of their working hours via smartphones.
- Among college students, 87% report anxiety when separated from their phones for over an hour.
- Digital well-being apps saw a 19% increase in installs, showing growing concern over smartphone overuse.
- 42% of people use smartphones while watching TV, showing continued multitasking trends.
- US adults now check their phones an average of every 11 minutes while awake.
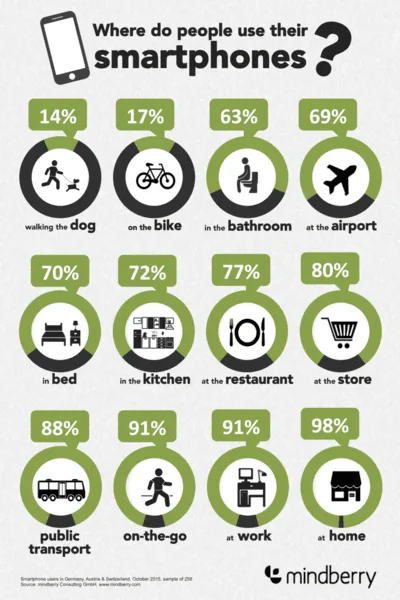
Where People Use Their Smartphones – Everyday Moments, Everywhere
- 14% use their phones while walking the dog, proving that digital life follows us even on casual strolls.
- 17% scroll or stream while biking, showing that staying connected often trumps disconnecting—even during workouts.
- 63% use smartphones in the bathroom, highlighting just how embedded screens are in our private routines.
- 69% reach for their devices at the airport, using them to pass time, check flights, or stay entertained.
- 70% are glued to their phones in bed, making late-night scrolling a near-universal habit.
- 72% multitask in the kitchen, using smartphones to follow recipes, stream, or chat while cooking.
- 77% browse or post while dining at restaurants, blending social interactions with screen time.
- 80% shop smarter at the store, relying on phones for reviews, discounts, or product comparisons.
- 88% engage online during public transit, turning commute time into digital catch-up sessions.
- 91% stay connected on the go, proving that mobility and connectivity now go hand-in-hand.
- 91% use smartphones at work, where mobile devices are tools for tasks, chats, and quick access.
- 98% use them at home, making it the #1 location for smartphone interaction.
Smartphone Sales by Price Segment
- In 2025, mid-range smartphones ($300–$599) captured 43% of global sales.
- Flagship models ($900 and above) accounted for 18% of units sold but generated 34% of total revenue.
- Budget smartphones (below $200) still represent 27% of the market, especially strong in Southeast Asia and Africa.
- The ultra-premium segment ($1,200+) grew by 8% YoY, driven by foldables and luxury Android models.
- In North America, mid-range phones outsold premium phones for the first time since 2019.
- Entry-level smartphones saw a 12% sales increase in India and Sub-Saharan Africa.
- Refurbished smartphones now make up 11% of global smartphone transactions in 2025.
- Sales of gaming-specific smartphones rose by 21%, with strong demand from mobile esports communities.
- Foldable phones are typically priced at $1,100–$1,800, but mid-tier models are emerging around $800.
- The price segment between $600–$800 shrank to just 8% of the market, as buyers either scaled down or up.
Average Selling Price of Smartphones Worldwide
- The global average selling price (ASP) of smartphones reached $402 in 2025.
- In the US, ASP stands at $681, making it one of the highest globally.
- In Western Europe, the ASP rose to $609, largely driven by iPhone and Samsung flagship pricing.
- In China, ASP is $432, reflecting a strong push in the mid-to-premium segment by Xiaomi and Huawei.
- India saw a dip in ASP to $226, as local brands and aggressive pricing strategies gain momentum.
- Refurbished smartphone ASP is $279, up 6% YoY, as demand shifts toward high-quality pre-owned devices.
- 5G-enabled smartphone ASP stands at $473, compared to $298 for 4G models.
- The ASP for foldables is still high at $1,241, although down 9% from last year due to broader competition.
- In Latin America, ASP is $312, relatively stable thanks to consistent currency pressures and import tariffs.
- ASP is projected to stay under $410 globally through 2026 as budget 5G phones grow in availability.
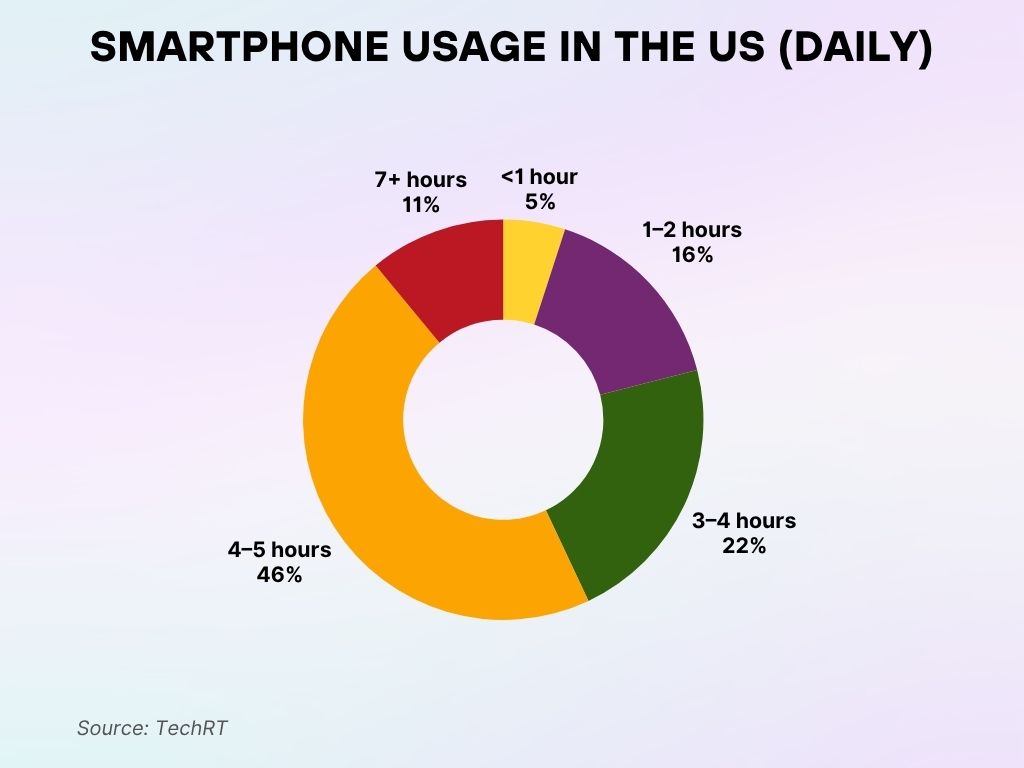
Daily Smartphone Usage in the US
- Just 5% of Americans limit themselves to under 1 hour of screen time each day, rare digital minimalists.
- 16% clock in around 1–2 hours daily, striking a more balanced mobile routine.
- 22% spend about 3–4 hours a day on their phones, right in the moderate usage zone.
- A hefty 46% use their smartphones for 4–5 hours daily, showing how deeply phones are woven into everyday life.
- 11% go all in with 7+ hours of screen time each day, true power users living in the digital fast lane.
Mobile Data Consumption on Smartphones
- In 2025, the global average mobile data usage per smartphone is 19.4 GB/month.
- In the US, data usage per smartphone averages 23.5 GB/month, with video streaming accounting for over 70%.
- India leads in growth, hitting 21.9 GB/month, driven by cheap data plans and streaming habits.
- Mobile gaming accounts for 13% of all mobile data consumption in developed markets.
- 5G users consume 33% more data than 4G users on average.
- In urban China, average monthly data usage per smartphone exceeds 26 GB, among the highest globally.
- Social media platforms like Instagram, TikTok, and Snapchat drive over 60% of app-related data usage.
- Monthly data usage for remote workers averages 28.7 GB, driven by video conferencing and file sharing.
- Video content in 4K and HDR formats increased mobile data usage by 18% YoY.
- Despite unlimited data plans, 42% of users actively track and manage their mobile data usage.
Mobile Gaming Statistics on Smartphones
- In 2025, mobile gaming revenue reached $103 billion, making up 51% of the global gaming market.
- 1.98 billion people play mobile games worldwide.
- The US mobile gaming market alone is worth $22.7 billion in 2025.
- Casual games dominate downloads, while battle royale and MMORPGs lead in revenue.
- On average, mobile gamers spend 42 minutes per day playing on smartphones.
- 37% of smartphone users have made at least one in-app gaming purchase this year.
- Subscription-based gaming models (e.g., Apple Arcade) saw a 19% rise in signups.
- In-game advertising revenue grew by 12%, reflecting better targeting and engagement.
- Mobile esports tournaments attracted over 82 million unique viewers in the first half of 2025.
- Gaming-focused smartphones (with built-in cooling systems and AMOLED displays) now account for 7% of high-end device sales.
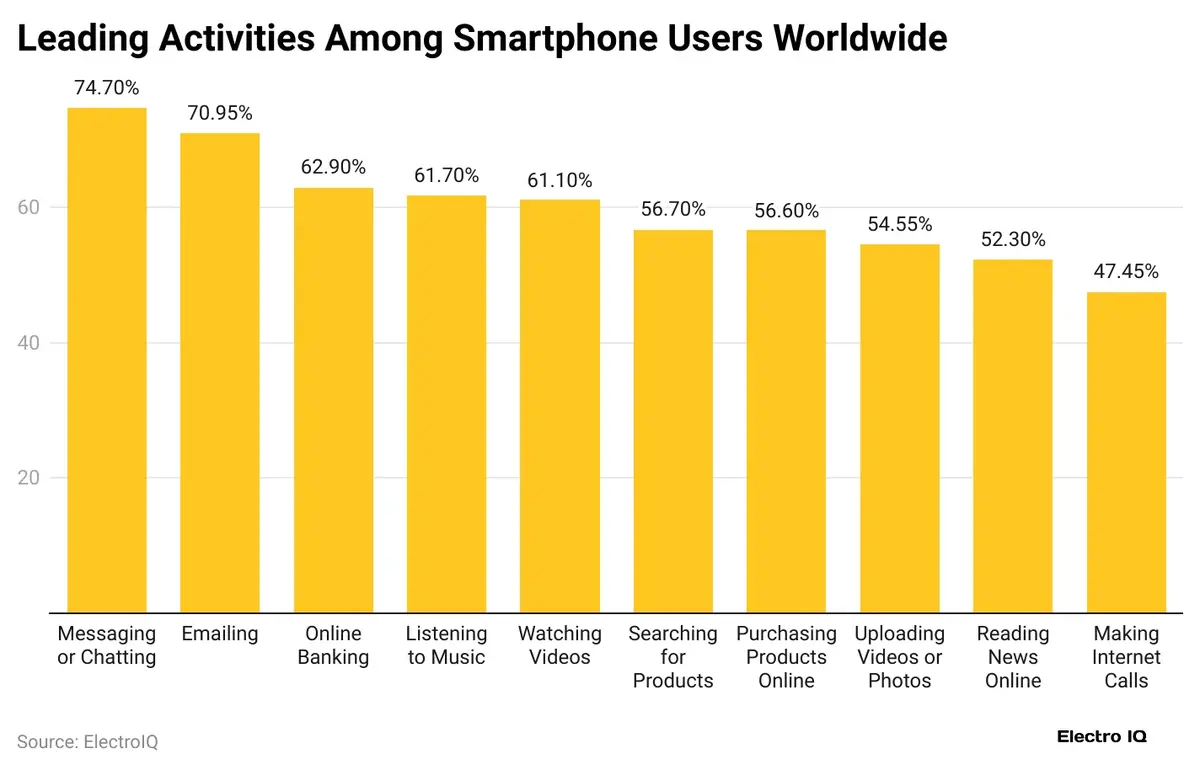
Top Things People Do on Their Smartphones Worldwide
- 74.7% of users are into messaging or chatting, instant communication is still the king of mobile activity.
- 70.95% check and send emails, showing that smartphones double as portable inboxes for work and life.
- 62.9% handle their banking online, proving that smartphones have become modern-day wallets and finance hubs.
- 61.7% stream their favorite music, making smartphones the go-to jukebox for every mood.
- 61.1% dive into video content, from short clips to long-form streams, screens are never short on action.
- 56.7% search for products online, changing how people discover what to buy.
- 56.6% go a step further by shopping directly on their phones, showing just how seamless mobile commerce has become.
- 54.55% upload photos or videos, proving that sharing life in real time is a mobile-first behavior.
- 52.3% get their news via smartphone, making it the new front page of the world.
- 47.45% make internet-based voice calls, as traditional calling continues to shift toward digital platforms.
Voice Assistant Usage on Smartphones
- In 2025, 68% of smartphone users globally use a voice assistant at least once per week.
- Google Assistant remains the most-used globally, followed closely by Apple’s Siri and Amazon’s Alexa (on Android).
- Among US users, 45% interact with voice assistants daily.
- The most common uses include setting reminders (72%), checking the weather (68%), and sending texts (61%).
- Multilingual voice command usage grew by 14%, especially among bilingual users in Europe and Asia.
- Voice search accounts for 29% of all mobile search queries in 2025.
- Smartphone voice assistant usage is highest among users aged 25–34, with 74% reporting frequent engagement.
- Nearly 34% of users now use voice assistants in noisy environments thanks to advanced noise cancellation.
- In-car voice assistant interactions increased by 23%, as more vehicles integrate with smartphones.
- Concerns about privacy still limit adoption: 38% of users avoid voice assistants due to data fears.
Security and Privacy Concerns Among Smartphone Users
- In 2025, 58% of global users list data privacy as their top concern when using smartphones.
- Biometric authentication usage (fingerprint or face ID) is at an all-time high of 81%.
- Over 47% of US users have installed at least one third-party privacy or security app.
- Data breach notifications rose 9% YoY, prompting a spike in security tool downloads.
- 61% of smartphone owners worry about apps collecting location data without consent.
- Two-factor authentication (2FA) is now enabled by 65% of users.
- 37% of people avoid using public Wi-Fi for mobile banking or e-commerce.
- Phishing via SMS (smishing) is on the rise, with incidents increasing by 18% YoY.
- Encrypted messaging apps like Signal and Telegram saw a 19% surge in downloads.
- 20% of users report using a VPN on mobile daily for added security.
Global Growth of Smartphone Users Over Time
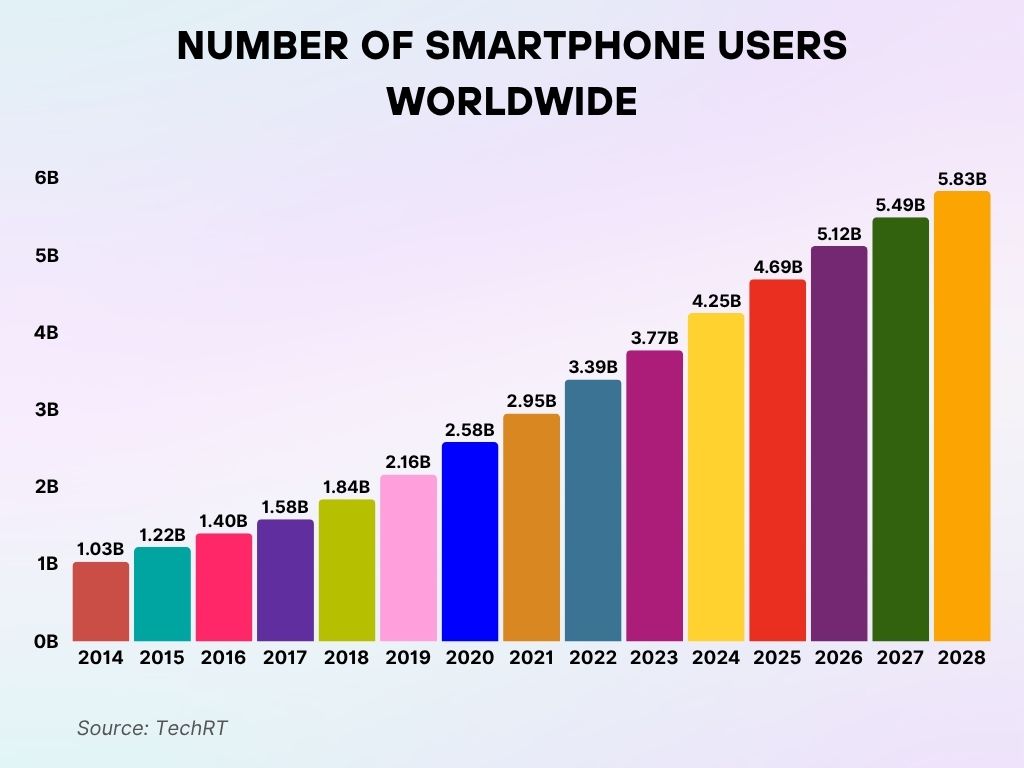
- Back in 2014, the world had just 1.03 billion smartphone users, still early days of the mobile revolution.
- By 2015, that number jumped to 1.22 billion, showing rapid adoption.
- 2016 saw a climb to 1.4 billion, as smartphones became more affordable and accessible.
- In 2017, usage hit 1.58 billion, gaining traction across emerging markets.
- 2018 brought the total to 1.84 billion, as connectivity continued to spread globally.
- By 2019, the user base surged to 2.16 billion, marking a major milestone.
- 2020 reached 2.58 billion, with the pandemic accelerating digital reliance.
- In 2021, users rose to 2.95 billion, approaching the 3-billion mark.
- 2022 crossed that line with 3.39 billion global users.
- 2023 continued the trend, climbing to 3.77 billion.
- The 2024 projection is a strong 4.25 billion smartphone users worldwide.
- By 2025, that number is expected to hit 4.69 billion, more than half the planet.
- 2026 forecasts show 5.12 billion users, as mobile-first becomes the norm.
- 2027 estimates point to 5.49 billion, reflecting global digital maturity.
- And by 2028, we’re looking at a projected 5.83 billion smartphone users globally.
Impact of Foldable and Modular Smartphones
- Foldable smartphone shipments reached 34 million units in 2025.
- Foldables now make up 2.5% of the total smartphone market, but account for 6.4% of global smartphone revenue.
- Samsung, Huawei, and Motorola continue to dominate the foldable segment with over 82% combined market share.
- Consumer interest in dual-screen foldables has increased, with 13% of premium buyers preferring them.
- Modular smartphones remain niche, representing less than 1% of market share, mostly in tech-savvy segments.
- Durability concerns still persist: 22% of foldable phone users report screen-related issues within the first year.
- Foldables are most popular in South Korea, China, and the US, where carriers heavily promote them.
- The average price of foldables dropped 12% YoY, aiding adoption in mid-premium markets.
- Battery life and hinge wear are the most common complaints among foldable users.
- Augmented reality (AR) applications are more commonly pre-installed on foldables, targeting productivity users.
Global Smartphone Market Share Breakdown
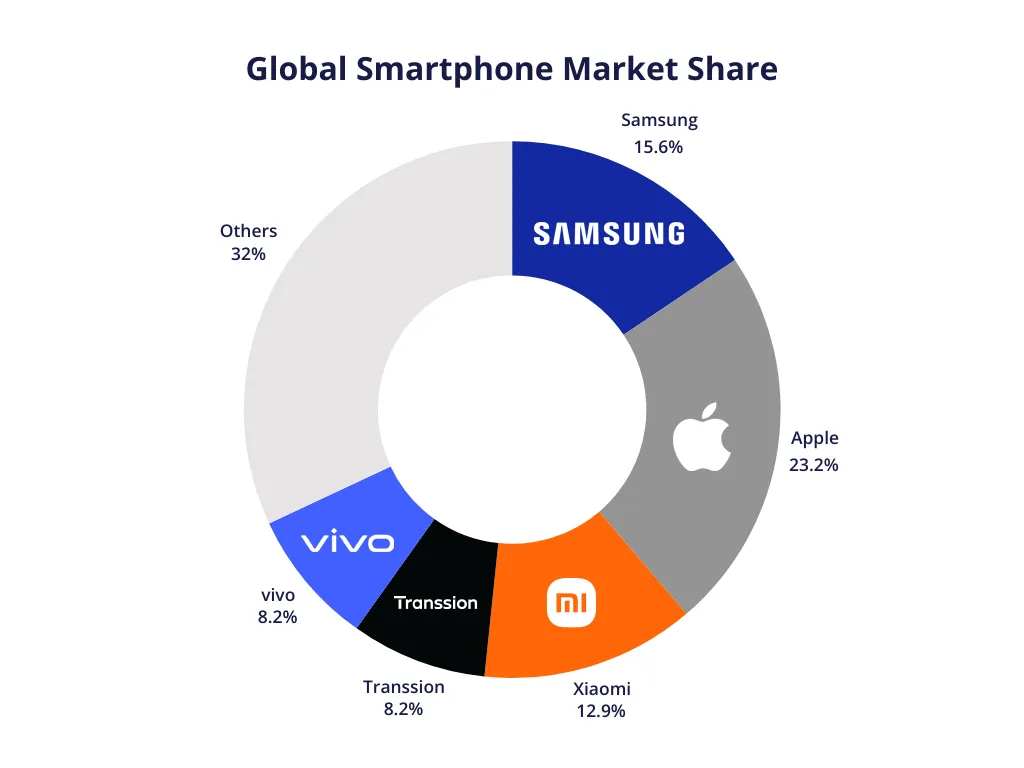
- Apple leads the pack with a commanding 23.2% of the global smartphone market—the iPhone reigns supreme.
- Samsung comes in strong at 15.6%, maintaining its position as a top Android contender.
- Xiaomi secures 12.9%, continuing its rise with feature-rich phones at competitive prices.
- Vivo grabs 8.2%, showing solid performance in key Asian markets.
- Transsion also claims 8.2%, making big waves in Africa and emerging regions.
- The “Others” category holds a significant 32%, reflecting a diverse and fragmented global market.
Recent Developments in Smartphone Technology
- In 2025, over 52% of new smartphones will include on-device AI chips for processing tasks without the cloud.
- Satellite connectivity has become a standard feature in 13% of high-end models, aiding communication in remote areas.
- Graphene battery trials began in mainstream brands, promising faster charging and longer life.
- Under-display selfie cameras now appear in 16% of flagship phones, helping maximize screen space.
- Optical zoom lenses (10x or more) have been integrated into over 40% of premium Android smartphones.
- eSIM adoption surpassed 60% globally, with many carriers phasing out physical SIM slots.
- Heat dissipation tech, such as vapor chambers, is now present in 28% of smartphones, especially in gaming models.
- Quantum dot OLED screens began rolling out in limited flagship devices, offering richer contrast and color accuracy.
- Neural-based user interfaces (NUIs), which learn user behavior, are now a core feature in top-tier Android phones.
- AI-powered call screening and spam detection have become standard in phones across the US, UK, and Canada.
Conclusion
From the rise of foldables to the growing dominance of AI, smartphones in 2025 are no longer just tools, they’re ecosystems. These pocket-sized computers continue to evolve rapidly, adapting to how we live, work, and connect. With over 6.6 billion people owning smartphones and dependency at an all-time high, the market shows no signs of slowing. Privacy concerns and regional trends will continue to shape the landscape, but one thing is certain: the smartphone’s role in our lives is more embedded and powerful than ever.


Leave a comment
Have something to say about this article? Add your comment and start the discussion.