When Sarah upgraded her phone last fall, she faced a dilemma many Americans know all too well: stick with iPhone or make the leap to Android? Her group chats, digital wallet, and even her fitness data were deeply tied into her iOS world. But the Pixel 8 Pro’s camera and customization called to her. This everyday tug-of-war between iPhone and Android isn’t just anecdotal; it reflects a much broader divide, with billions of users worldwide making choices that shape the tech industry.
In 2025, the line between iOS and Android isn’t just about hardware, it’s about ecosystems, user habits, and digital identity. This report dives deep into the latest data to explore how the two platforms stack up across satisfaction, usage, marketing impact, and more.
Editor’s Choice
Here are seven standout statistics capturing the iPhone vs. Android dynamic in 2025:
- iOS commands 58.2% of the US smartphone market in 2025.
- Globally, Android holds 69.6% of smartphone market share, while iOS accounts for 29.8%.
- 88% of iPhone users report satisfaction with their devices in 2025, compared to 74% for Android users.
- The average iPhone user spends 4.8 hours daily on their device, versus 4.3 hours for Android users.
- iPhone users are 23% more likely to use mobile payments compared to Android users in North America.
- In 2025, iOS app store revenue reached $124 billion, while Google Play generated $58 billion globally.
- 62% of Gen Z users in the US prefer iPhones, compared to 35% using Android devices.
iPhone vs. Android App Spending Trends
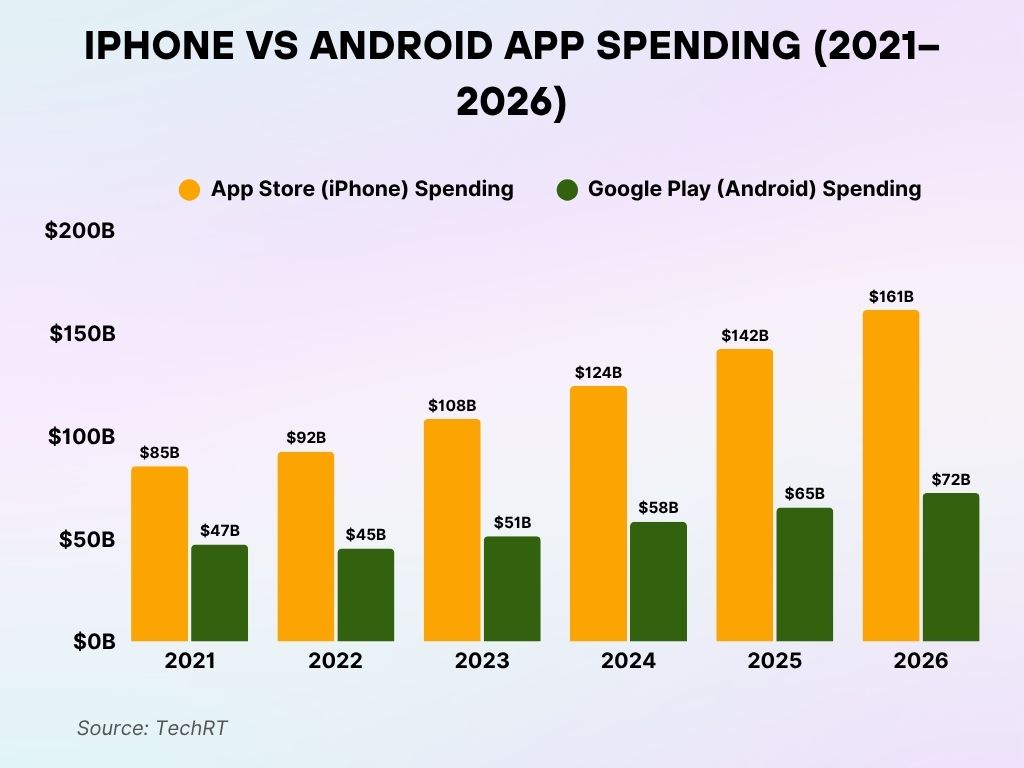
- In 2021, iPhone users spent a massive $85 billion on the App Store, nearly double Android’s $47 billion on Google Play.
- By 2022, iPhone spending grew to $92 billion, while Android dipped slightly to $45 billion.
- The trend continued in 2023, with iPhone app revenue hitting $108 billion, compared to $51 billion on Android.
- In 2024, iPhone users spent a record $124 billion, as Android users followed with $58 billion.
- For 2025, App Store spending soared to $142 billion, while Google Play reached a new high of $65 billion.
- Looking ahead to 2026, projections show iPhone app spending will climb to $161 billion, and Android’s to $72 billion.
Key Insight: iPhone users consistently spend more on apps than Android users, by a margin of over 2x every year.
Consumer Satisfaction Scores: iPhone vs. Android
- iPhone leads with a 90% Net Promoter Score (NPS) among users aged 18–34 in the US, while Android trails at 68%.
- In 2025, only 8% of iPhone users plan to switch to Android for their next upgrade, versus 24% of Android users eyeing iOS.
- iOS users rate device reliability at 9.2/10, with Android averaging 8.1/10 across major brands.
- Customer support satisfaction was 36% higher for Apple users compared to the average Android OEM.
- 83% of iPhone users feel their phone “just works”, compared to 59% for Android, a reflection of tight ecosystem integration.
- Battery life satisfaction improved 18% year-over-year for Android users in 2025, thanks to adaptive power management innovations.
- In the US, 92% of iOS users are satisfied with OS updates and security support, versus 64% of Android users, largely due to device fragmentation.
Social Media Usage by iOS and Android Users
- iOS users spend an average of 2.6 hours/day on social media apps in 2025, while Android users average 2.2 hours.
- Instagram and TikTok see 40% more engagement per user on iPhones compared to Android.
- Snapchat usage is 2.3x higher among iOS users, especially within Gen Z cohorts in the US.
- Android users globally show 23% higher engagement on Facebook and WhatsApp, particularly in emerging markets.
- iOS accounts for 64% of mobile influencer-driven purchases, despite Android’s larger user base.
- Social video app CapCut saw a 34% higher in-app purchases from iOS users in 2025.
- 84% of US-based mobile content creators use iPhones as their primary device for short-form content production.
iPhone vs. Android: Customer Loyalty Breakdown
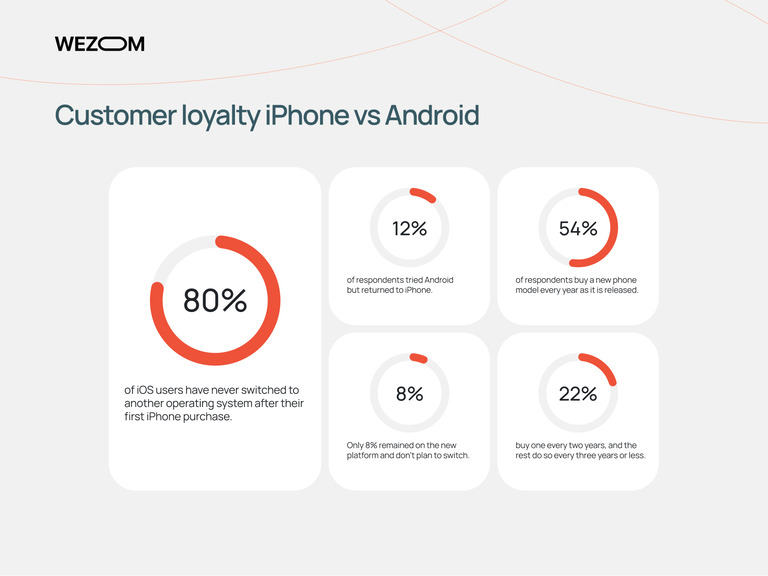
- A strong 80% of iPhone users have never switched platforms since their first iOS experience—true brand loyalty.
- 12% of users who tried Android eventually came back to iPhone, proving its strong user pull.
- A surprising 54% of users are so loyal that they upgrade yearly with every new model launch.
- Just 8% of switchers actually stuck with a new platform and have no intention of returning.
- 22% prefer to upgrade every two years, while the rest are on a three-year or shorter cycle.
Insight: iPhone’s ecosystem keeps users coming back, loyalty is high, and most don’t stay away for long.
Mobile Advertising Reach and Effectiveness
- In 2025, iOS drives 63% of mobile ad revenue in the US, despite a smaller global market share.
- Android delivers 2.1x more ad impressions globally, especially in regions like Southeast Asia, Latin America, and Africa.
- Cost-per-install (CPI) on iOS is $2.88, compared to $1.54 on Android, making iOS costlier but with higher lifetime value per user.
- iPhone users click 27% more often on app install ads than Android users in North America.
- Ad targeting precision on iOS declined 15% year-over-year due to privacy policy restrictions, notably App Tracking Transparency (ATT).
- Android retained a 42% higher retargeting success rate in 2025 due to more lenient tracking permissions in many apps.
- iOS leads in conversion rates for luxury and finance apps, converting 34% higher than Android for fintech downloads.
- In emerging markets, Android yields better ROI for e-commerce app advertising, especially in India and Brazil.
- 60% of marketers in the US prioritize iOS for high-value audience targeting, compared to 28% for Android.
- iOS users contribute 74% of mobile ad-driven in-app purchases, showing greater monetization potential.
Mobile Gaming Trends by Platform
- Android users account for 57% of all global mobile gamers in 2025, with significant reach in Asia-Pacific and South America.
- iOS users spend 2.3x more on mobile games, totaling $54 billion in gaming purchases vs. $23 billion for Android globally.
- Game developers earn 1.8x more revenue per user on iOS, largely due to in-app purchase behavior.
- Hyper-casual games see 3x more downloads on Android, while strategy and RPG titles dominate iOS earnings.
- Subscription-based mobile gaming grew 32% YoY on iOS, driven by services like Apple Arcade.
- In 2025, Android leads in mobile esports engagement, particularly in Indonesia, South Korea, and Brazil.
- AR-based games (like Pokémon GO successors) report 64% of their revenue coming from iOS users.
- iPhone 15 and 16 Pro models support 120Hz adaptive gaming, boosting user retention in graphics-heavy games by 19%.
- Android users download 38% more mobile games per year, but uninstall rates are also 28% higher.
- Mobile ad monetization in gaming apps earns developers 35% more per thousand impressions (eCPM) on iOS.
Global iPhone User Growth Over the Years
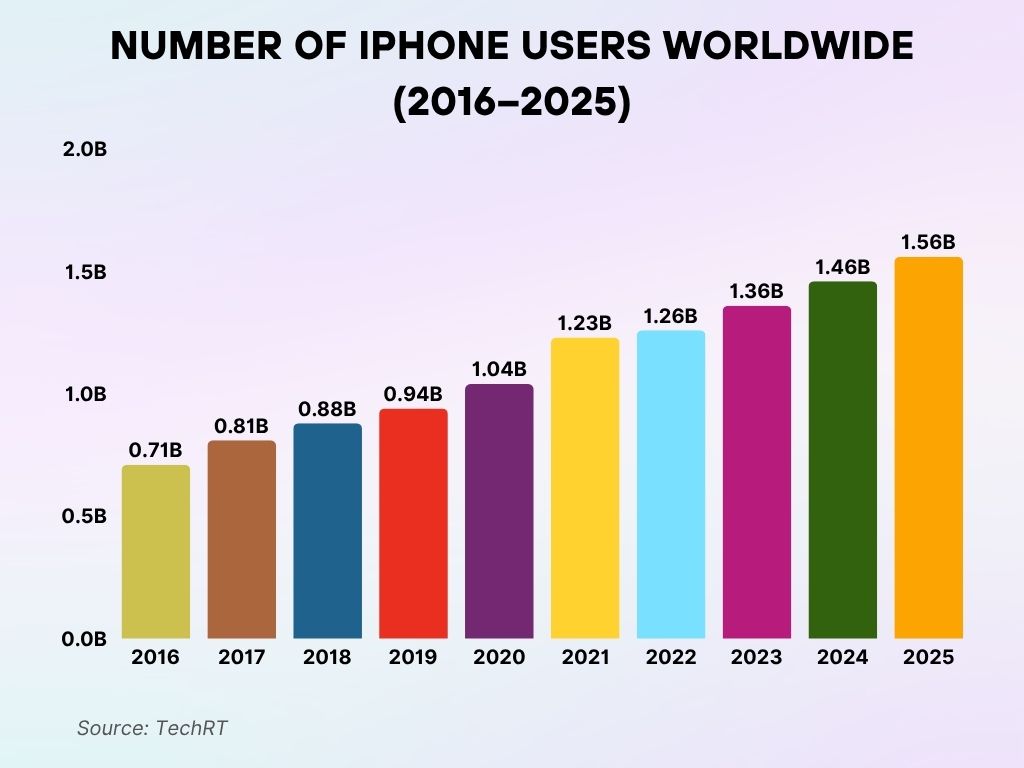
- Back in 2016, there were 0.71 billion iPhone users around the world.
- By 2017, the number rose to 0.81 billion, continuing Apple’s upward trend.
- In 2018, iPhone users reached 0.88 billion globally.
- The count hit 0.94 billion in 2019, inching closer to the billion mark.
- 2020 was a milestone year as Apple crossed 1.04 billion users.
- A major leap came in 2021, with users surging to 1.23 billion.
- Growth continued steadily in 2022, reaching 1.26 billion users.
- 2023 saw the total climb to 1.36 billion worldwide.
- In 2024, the iPhone user base hit 1.46 billion.
- For 2025, it’s projected to reach a whopping 1.56 billion users globally.
Regional Performance Breakdown (Asia, Europe, Americas)
- In North America, iOS dominates with 58.2% market share, holding steady as the preferred choice among younger demographics and professionals.
- Android holds a commanding 85% share in India, largely driven by affordability and wide OEM diversity.
- In Western Europe, iOS continues to grow, reaching a 35.7% share in 2025, especially in Germany and France.
- Latin America remains Android-heavy (92%), but Apple’s market share in Brazil has doubled since 2021, now at 12.4%.
- In Japan, iOS reigns with over 67% of the smartphone market, driven by ecosystem loyalty and device quality.
- In South Korea, Android holds a 76% share, led by domestic champions like Samsung.
- Australia shows a balanced split, with iOS at 49.3% and Android at 50.1%, reflecting device parity and competitive plans.
- Africa is 89% Android, though iOS usage is growing among urban elites in Nigeria, Kenya, and South Africa.
- In China, Android dominates at 80%, but premium iPhone sales have surged post-pandemic, especially the iPhone 15 Pro Max.
- iPhone revenue per user is highest in the US, averaging $812 annually, compared to $324 for Android users in the same market.
Environmental Impact and E-Waste Contribution
- Apple recycled over 46,000 metric tons of devices in 2024, with 2025 targets exceeding 52,000 metric tons.
- In contrast, Android OEMs collectively recycled 29,000 metric tons, reflecting disparities in supply chain circularity.
- iPhones have an average lifecycle of 4.3 years, while Android devices average 2.8 years before being replaced.
- Refurbished iPhones made up 23% of global iPhone sales in 2025, doubling from 2022.
- Apple’s carbon footprint per device dropped by 21% YoY, aided by a shift to recycled rare earth metals.
- Samsung, Xiaomi, and Oppo pledged carbon neutrality by 2035, but trail Apple’s aggressive 2030 timeline.
- Android e-waste contributes 3.1 million tons annually, largely due to lower-end devices and inconsistent upgrade cycles.
- iOS update support spans 6–7 years, keeping older devices usable longer and reducing waste.
- Apple introduced a self-repair program in 2025, now active in 38 countries, promoting DIY fixes and part reuse.
- Only 18% of Android users report recycling old phones, compared to 34% of iPhone users, based on recent global surveys.
iPhone vs. Android: Usage by Age Group
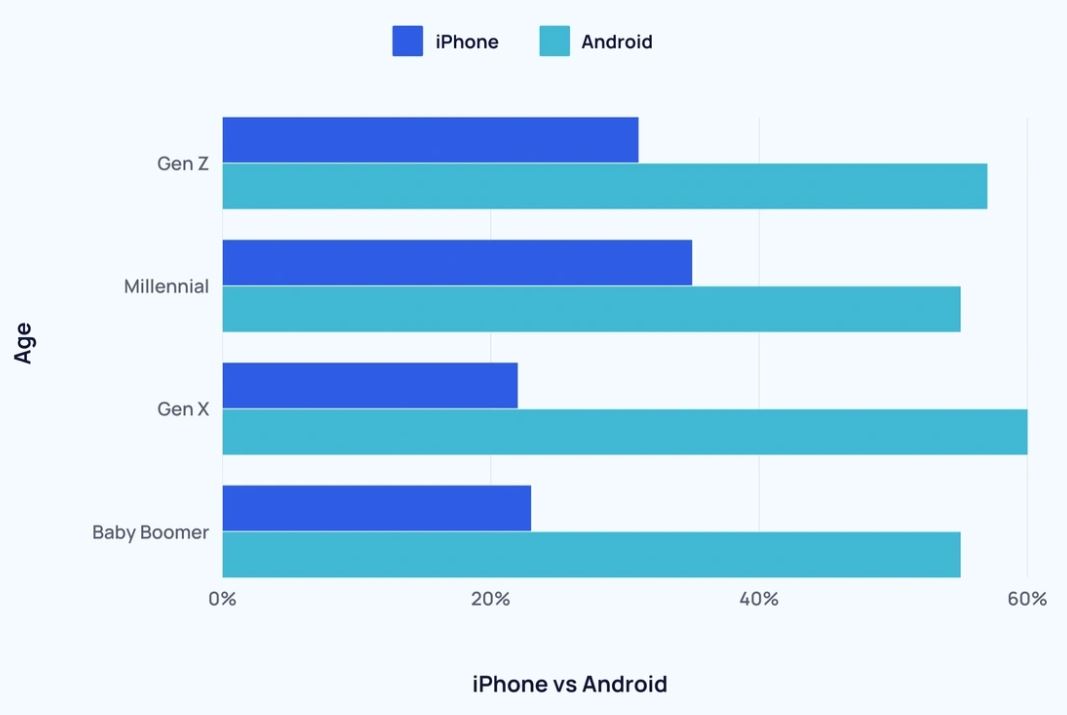
- Gen Z leans slightly toward Android, with 60% on Android and 40% using iPhones.
- Among Millennials, Android still leads at 55%, while 35% prefer iPhones.
- Gen X shows an even bigger gap, only 25% use iPhones, while nearly 60% stick with Android.
- For Baby Boomers, iPhone usage drops to just 20%, as Android dominates with 55%+ adoption.
Accessibility and Assistive Technology Adoption
- iOS leads with 94% user satisfaction for built-in accessibility tools, such as VoiceOver, Magnifier, and Live Speech.
- Android’s TalkBack usage rose by 23% year-over-year, thanks to wider language and regional support updates.
- Apple’s AssistiveTouch feature adoption increased 18%, particularly among users with mobility impairments.
- More than 12% of iPhone users rely on at least one accessibility feature daily in 2025.
- Android 14 and 15 introduced AI-driven accessibility improvements, including real-time captioning and camera-based text detection.
- iOS users are 2.5x more likely to use screen readers or audio navigation tools compared to Android users in the US.
- Hearing aid compatibility ratings (M3/T4) are supported in 100% of iPhones, compared to 78% of Android flagship models.
- Android tablets lag behind iPads in accessibility benchmarks, particularly in educational settings.
- Apple’s Personal Voice feature, introduced in 2024, is now used by over 2.1 million iPhone users globally.
- Android users in emerging markets show increased adoption of text-to-speech tools, especially among elderly populations.
Mobile Payment Usage by OS
- 78% of iPhone users in the US use Apple Pay regularly, compared to 53% of Android users who use Google Pay or Samsung Wallet.
- Apple Pay accounted for $1.3 trillion in global transaction volume in 2025, compared to $860 billion for all Android payment platforms combined.
- Tap-to-pay functionality is active on 97% of iPhones, versus 82% of Android devices.
- Android dominates QR code-based mobile payments in Asia, particularly in India and Southeast Asia.
- 40% of Gen Z Android users in the US now use Google Pay weekly, narrowing the adoption gap with iOS.
- Apple Pay Later saw a 65% increase in user enrollment, especially among Millennial and Gen Z shoppers.
- iOS users are 3x more likely to use mobile wallets for event ticketing and transportation passes.
- Wearable payment adoption (Apple Watch, Galaxy Watch) is higher on iOS, with 41% usage, versus 19% on Android.
- Android users in Europe prefer third-party wallets like Revolut and Klarna, while iOS dominates in direct app integrations.
- Apple Pay loyalty card usage grew 2.1x in 2025, helped by retailer integrations and dynamic offers.
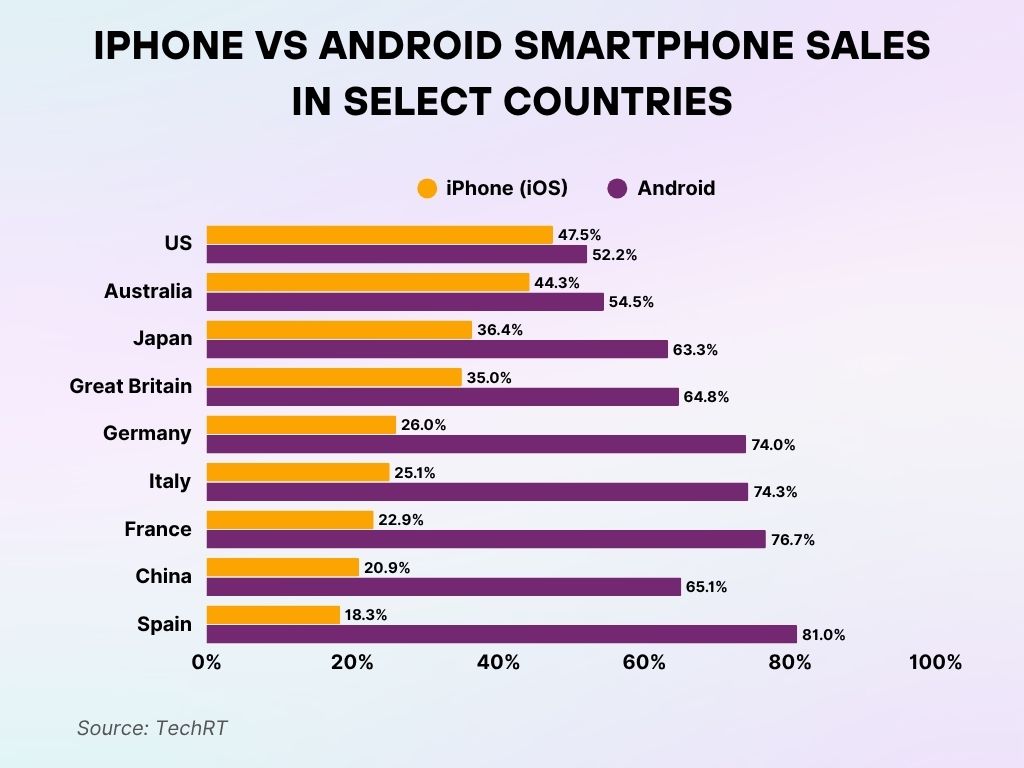
iPhone vs. Android: Smartphone Sales by Country
- United States: A close race, iPhone holds 47.5%, while Android edges ahead with 52.2%.
- Australia: Android leads with 54.5%, leaving iPhone at 44.3%.
- Japan: Android dominates with 63.3%; iPhone trails at 36.4%.
- Great Britain: Android takes 64.8%, nearly double the iPhone’s 35%.
- Germany: A major gap, Android owns 74% of the market, while iPhone lags at 26%.
- Italy: Android at 74.3% comfortably beats iPhone’s 25.1%.
- France: Android leads big with 76.7%, leaving iPhone far behind at 22.9%.
- China: Android commands 65.1%, while iPhone holds just 20.9%.
- Spain: Android reigns supreme with 81%, giving iPhone a mere 18.3%.
Time Spent on Devices by Platform
- In 2025, iPhone users spend an average of 4.8 hours per day on their devices.
- Android users log an average of 4.3 hours daily, with higher variance across regions and income levels.
- US iPhone users check their phones 96 times a day, compared to 83 for Android users.
- Entertainment apps account for 42% of screen time on iPhones, while Android splits more evenly between utilities, social, and games.
- iPhone users spend 1.6x more time in finance apps, largely due to integrated tools like Apple Card and savings.
- Screen Time reports are used by 61% of iOS users, versus 27% of Android users with Digital Wellbeing enabled.
- Night Mode (blue light filters) usage is slightly higher on Android (65%) vs. iOS (62%) due to broader OEM defaults.
- Parental control adoption is higher on iOS (38%) vs. Android (24%), especially among families with children under 13.
- iPhone users in the US spend 31% more time on premium streaming platforms, including Apple TV+, Hulu, and Netflix.
- Android users spend more time multitasking with split-screen and picture-in-picture features, especially on foldable devices.
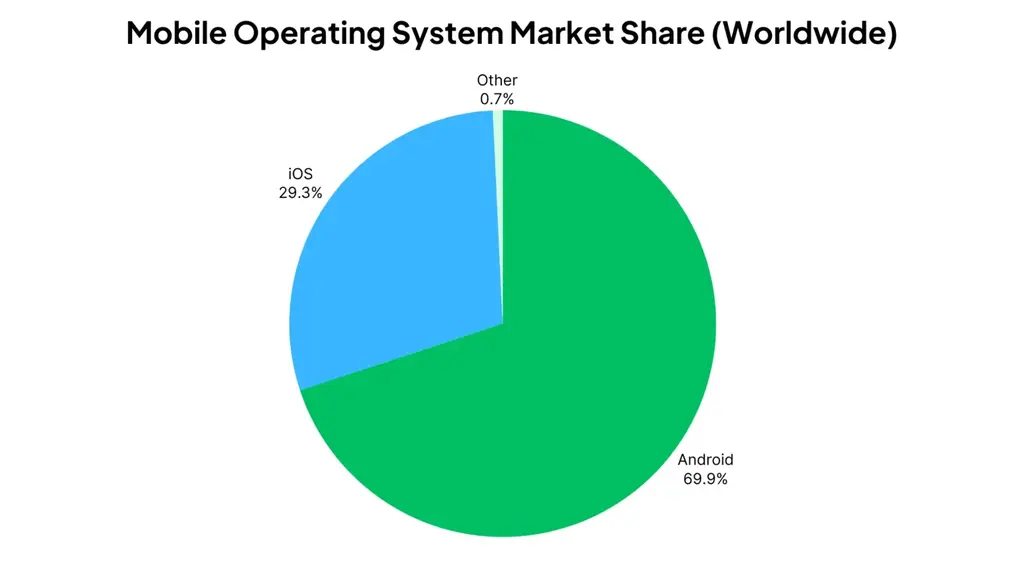
Global Mobile OS Market Share Snapshot
- Android leads the world with a commanding 69.9% market share, nearly 7 out of 10 smartphones run on it.
- iOS follows solidly with 29.3%, securing a strong second place in the mobile OS race.
- All other platforms combined (like KaiOS, HarmonyOS, etc.) make up a tiny 0.7%, barely making a dent.
Recent Developments
- Apple released iOS 18 in April 2025, introducing native AI image generation and personalized Siri routines.
- Google launched Android 15 with Gemini AI fully embedded, enhancing contextual awareness in apps and search.
- Apple Vision Pro compatibility expanded, enabling seamless content handoff between iPhone and headset.
- Samsung’s Galaxy S25 Ultra debuted with satellite messaging and 200MP camera updates, challenging the iPhone’s imaging edge.
- Apple’s Neural Engine (A18 chip) showed 43% faster machine learning performance over Android’s latest Tensor G4 chipset.
- App sideloading is now partially available on iOS in the EU, marking a significant policy shift driven by regulatory changes.
- Google introduced Private Space, a secure sandbox for sensitive apps and data, exclusive to Android 15.
- Apple doubled down on privacy with on-device AI only, avoiding cloud-based processing for personalized recommendations.
- iPhone sales in the US rose 6.2% in Q1 2025, while Android device shipments declined 2.1% in the same period.
- Both Apple and Google committed to 7 years of OS and security updates starting with the 2025 flagship releases.
Conclusion
The iPhone vs. Android debate in 2025 isn’t a simple matter of brand loyalty, it’s a reflection of ecosystems, values, and daily behaviors. iPhone dominates in revenue, user satisfaction, and premium experiences. Android remains unmatched in reach, flexibility, and regional adaptability.
As both platforms push deeper into AI, accessibility, and sustainability, users are no longer just choosing a phone, they’re choosing how they connect, pay, play, and live. The statistics show a world split not evenly, but dynamically, where one side leads in revenue, and the other in reach.
Whether you swipe up or tap back, the numbers tell the story: there’s no winner, only what’s right for you.


Leave a comment
Have something to say about this article? Add your comment and start the discussion.