At first glance, our hyperconnected world seems like a marvel; everything from entertainment and education to work and socializing is at our fingertips. But as digital tools continue to reshape how we live, subtle consequences are becoming harder to ignore. Parents are asking why their children aren’t sleeping well. Employees feel fatigued after just a few hours at their desks. And healthcare professionals are raising concerns about the rising mental and physical strain tied to screen time.
Technology is not inherently harmful. However, the unregulated, prolonged, and passive use of digital devices is creating measurable impacts across age groups. This article explores key 2025 statistics highlighting the darker side of technology’s rapid advancement, from sleep disruption and digital eye strain to its toll on physical well-being.
Editor’s Choice
Here are some standout 2025 stats on the negative effects of technology:
- 68% of US adults report that screen time has significantly affected their sleep patterns.
- 1 in 3 teens now experience chronic fatigue linked to late-night device usage.
- Over 59% of office workers report digital eye strain as a weekly issue.
- 42% of Gen Z users check their phones within 5 minutes of waking up, disrupting natural sleep cycles.
- 82% of pediatricians believe excessive screen exposure is contributing to behavioral issues in children.
- The average American spends 7.4 hours per day looking at screens.
- 26% of surveyed adults say they’ve experienced physical pain (neck, wrist, or back) directly due to extended tech use.
- Sleep quality scores have dropped by 12% since 2022 among heavy digital users.
- Blue light exposure after 10 p.m. has increased by 35% among 18 to 35-year-olds.
- Only 17% of adults regularly use blue light filters or apps despite rising awareness.
Smartphone Habits Among UK Users
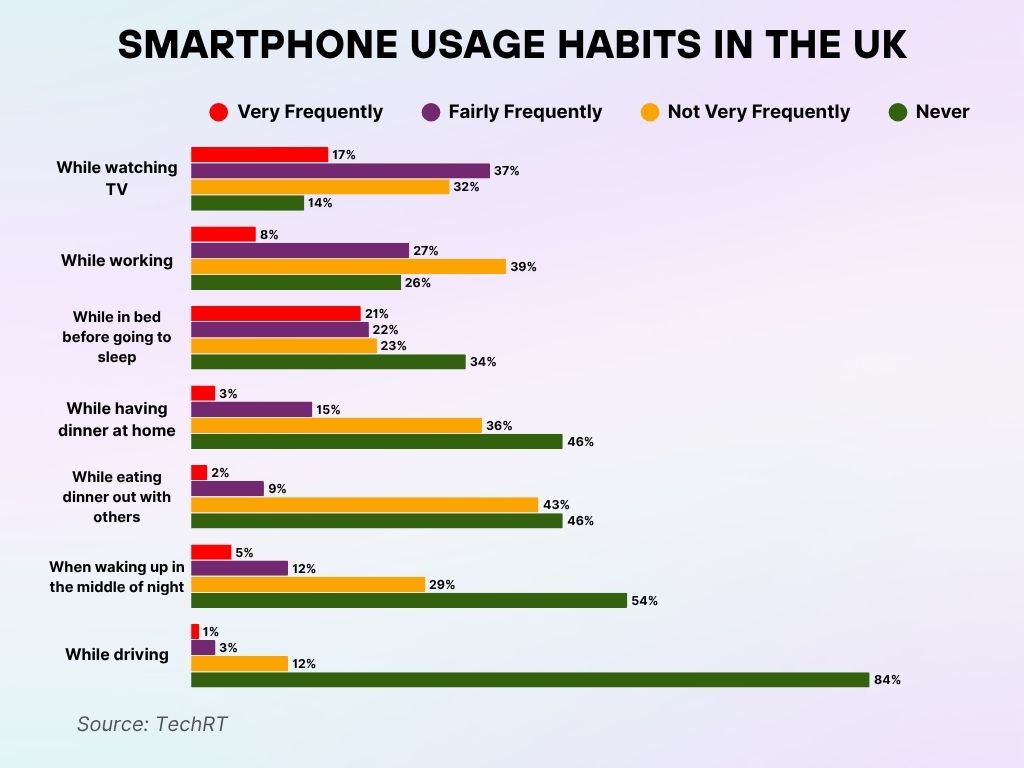
- Over half (54%) of UK adults resist the urge to check their phones if they wake up in the middle of the night, but 17% frequently do so.
- During TV time, 54% admit to regularly reaching for their phones, while just 14% refrain entirely from using them.
- At work, only 26% completely avoid their smartphones, whereas 35% use them often, indicating digital distractions remain common on the job.
- When dining out, 43% glance at their phones occasionally, and 46% stay completely disconnected from their screens.
- Before bedtime, 34% avoid phone usage, but 43% of individuals frequently engage with their devices just before sleep.
- At the dinner table at home, 46% say they never use their phones, compared to 18% who admit they do so regularly.
- Encouragingly, 84% steer clear of phone use while driving, with only 4% acknowledging frequent usage behind the wheel.
Technology and Sleep Disruption Data
The connection between screen time and poor sleep has become a major concern for researchers and clinicians alike. Digital devices, especially smartphones, continue to interfere with natural sleep rhythms in 2025.
- 74% of US adults report poorer sleep when using screens within one hour of bedtime.
- Teenagers (13–17) now average 6.1 hours of sleep per night, below the CDC’s recommended 8–10 hours.
- 47% of adults say scrolling social media before bed delays their sleep by at least 30 minutes.
- Nighttime blue light exposure is now linked to reduced melatonin levels in 6 out of 10 individuals.
- Smart device usage after 10 p.m. has increased by 29%.
- 35% of children under 12 have screen time just before bed, contributing to increased reports of restlessness and disrupted sleep cycles.
- Sleep apps and wearables track rest but also increase screen exposure, creating a paradox for users seeking better sleep.
- Adults who don’t use screens before bed report 22% higher sleep satisfaction than those who do.
- Frequent late-night notifications interrupt sleep for 28% of Americans, especially those under 40.
- Digital detox programs are gaining traction, but only 12% of users stick with them for more than 30 days.
Technology-Induced Eye Strain and Physical Health
Digital eye strain and posture-related injuries are becoming increasingly common among professionals, students, and young users spending hours in front of screens.
- 61% of Americans reported at least one symptom of Computer Vision Syndrome (CVS) in 2025.
- Dry eyes, blurred vision, and headaches are the top reported symptoms linked to prolonged screen use.
- Office employees working remotely report a 17% increase in posture-related complaints.
- Children aged 6–12 show a 26% increase in nearsightedness, with excessive screen time being a key contributor.
- 48% of gamers experience neck or wrist pain after long gaming sessions.
- Sitting for more than 8 hours a day in front of screens correlates with a 34% higher risk of musculoskeletal problems.
- Only 1 in 5 workers takes regular screen breaks every hour, despite employer guidelines.
- Eye strain-related productivity loss costs US companies an estimated $5.7 billion annually.
- Increased tech usage during hybrid work schedules has led to 37% of professionals reporting chronic back pain.
- Blue light glasses usage is up by 23%, yet many users report unclear benefits without proper screen habits.
How Social Media Addiction Varies by Age in the US
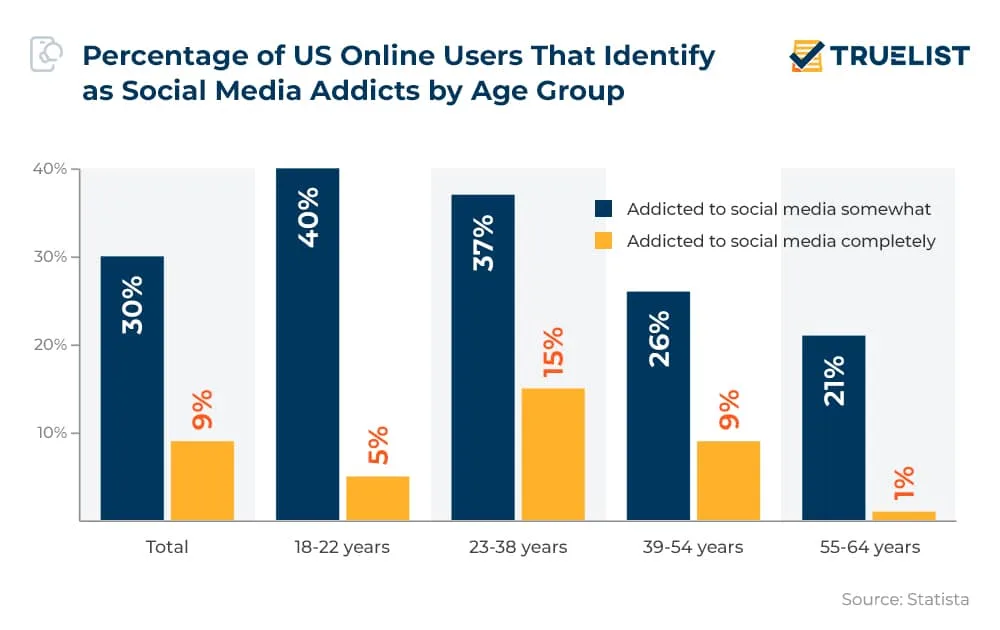
- In the US, 30% of internet users consider themselves somewhat addicted to social media, while 9% openly admit to being completely addicted.
- The most impacted group appears to be young adults aged 18–22, with 40% feeling somewhat dependent and 5% acknowledging full addiction.
- Those aged 23–38 show a similar trend, with 37% identifying moderate dependency and 15% — the highest across all groups — reporting full addiction.
- Among users aged 39–54, 26% say they are somewhat hooked, and 9% feel completely addicted.
- The least affected age group is 55–64, with just 21% reporting mild addiction and only 1% saying they’re fully addicted to social media.
Social Isolation and Technology Use Figures
While technology connects us globally, it often disconnects us emotionally. The paradox of feeling alone in a crowded digital space has become more pronounced in recent years, especially among youth and remote workers.
- 52% of US adults feel more isolated now than before they became regular smartphone users.
- 38% of teens say they feel lonelier after spending extended time on social media.
- People spending more than 4 hours/day on social media report 23% higher rates of depression.
- 41% of Gen Z say they find it harder to form real-world friendships due to online communication habits.
- Remote workers report a 27% increase in feelings of social detachment compared to in-office peers.
- Group chats and virtual hangouts have replaced in-person meetups for 46% of Millennials.
- 31% of surveyed users admitted that scrolling made them feel left out or inadequate.
- One-third of older adults (65+) report feeling “technologically left behind,” deepening generational gaps and isolation.
- Daily video calls for work are linked to “Zoom fatigue” symptoms in 62% of users.
- Only 18% of US users say digital communication makes them feel emotionally connected.
Managing Screen Time: How Much is Too Much?
Screens have become an inseparable part of daily life—but at what cost? 2025 marks another year of increasing screen dependence, with new health recommendations emerging as countermeasures.
- The average American adult now spends 7.4 hours/day on screens.
- Children aged 8–12 spend about 5.5 hours/day in front of screens for non-educational purposes.
- Only 14% of parents successfully limit their kids’ screen time to under 2 hours/day.
- 61% of adults report difficulty reducing screen time even when they try.
- Screen time among adults jumped by 19% during the rise of remote and hybrid work models.
- Teen screen addiction has become so common that 1 in 4 parents say it’s their top parenting concern.
- Digital wellbeing apps are installed on 38% of smartphones, yet fewer than 11% of users check them weekly.
- Blue light exposure from screens is linked to increased anxiety in users spending more than 6 hours/day online.
- Screen time reduction efforts (like device-free zones) are adopted in only 9% of US households.
- Children who exceed 6 hours of daily screen use show a 35% higher risk of attention issues.
What People Think About Technology’s Role in Education
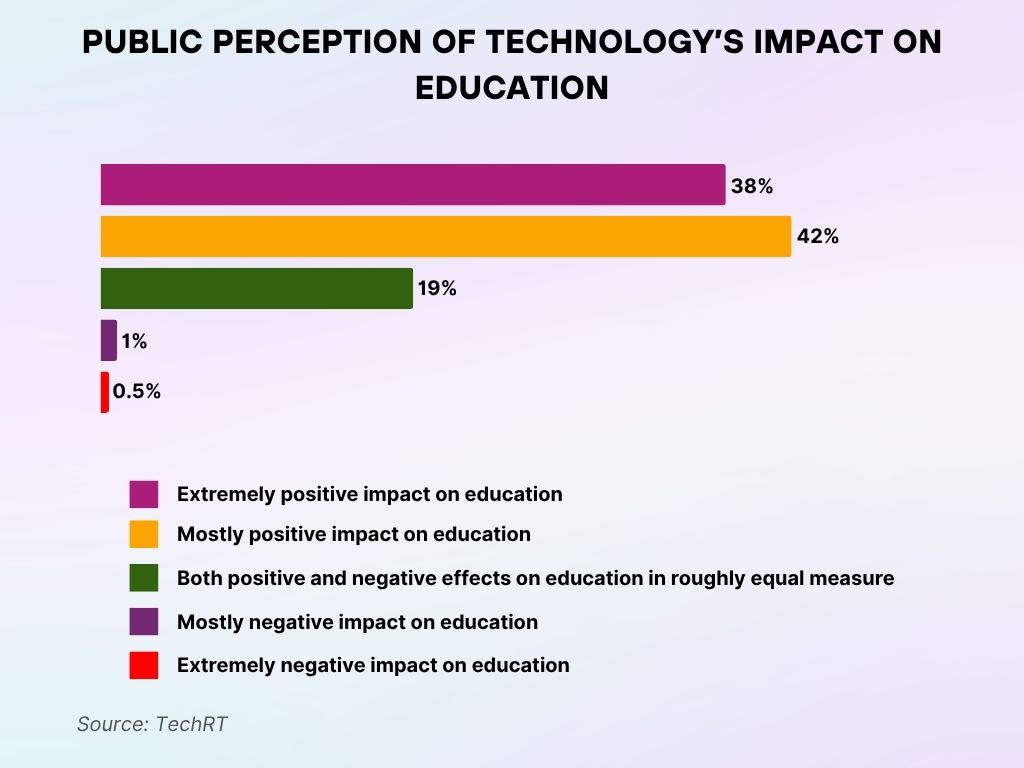
- A resounding 0% of respondents believe technology has an extremely negative effect on education — a clear sign of widespread optimism.
- The most common sentiment, held by 42%, is that technology has a mostly positive impact on learning environments.
- Meanwhile, 38% express even stronger approval, stating it has an extremely positive influence on education overall.
- Some respondents (19%) take a balanced view, saying technology brings both benefits and drawbacks in equal measure.
- Only a fraction — less than 1% — view it negatively, believing it has a mostly harmful effect on education.
Workplace Productivity and Digital Distraction
Technology is a powerful work enabler, but it’s also a productivity killer when misused. Notifications, multitasking, and nonstop availability have reshaped how (and how well) people focus on the job.
- 72% of employees admit that notifications distract them multiple times per hour.
- On average, it takes 23 minutes to refocus after a digital interruption.
- Workers now check their email or messaging apps once every 6 minutes.
- 39% of remote employees report spending time on social media during working hours.
- 46% of surveyed managers believe productivity has declined due to multitasking across apps.
- App-switching accounts for 2.1 hours/day of lost productivity in hybrid work models.
- 67% of employees say they feel mentally drained from screen-based meetings and virtual collaboration tools.
- Companies that implemented “digital detox blocks” saw a 21% boost in focus and task completion.
- The average remote worker now uses 9+ digital platforms daily to complete job-related tasks.
- Only 22% of employees say their workplace promotes mindful screen usage or offers breaks from tech.
Cyberbullying and Online Harassment Rates
As digital engagement grows, so does digital hostility. Cyberbullying is no longer limited to teenagers; it has extended into adult environments, from gaming communities to professional platforms.
- 48% of US teens report experiencing cyberbullying in the past 12 months.
- 27% of adults have faced harassment or threats on social media.
- Women, especially ages 18–34, are twice as likely as men to experience online abuse.
- Bullying via group chats is the fastest-growing form of teen cyber harassment in 2025.
- In online gaming, 37% of players have experienced targeted verbal abuse or threats.
- 1 in 5 remote employees report harassment or toxic behavior during virtual meetings or messaging threads.
- Only 13% of victims report online abuse to platform authorities.
- LGBTQ+ individuals are at a 40% higher risk of experiencing cyberbullying than non-LGBTQ+ peers.
- AI-generated deepfakes used for bullying or blackmail have surged by 31% since.
- 71% of parents feel that schools and platforms aren’t doing enough to curb online abuse.
Comparing Daily Screen Time: Computers vs. Phones
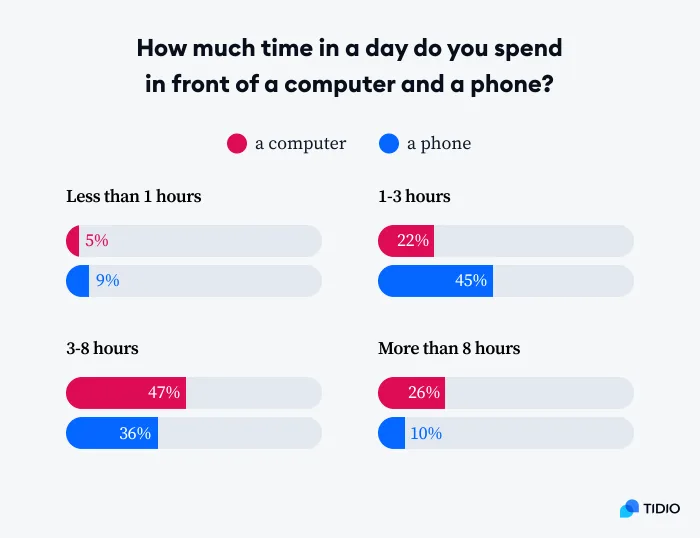
- When it comes to minimal usage, just 5% of people spend under an hour on a computer, while slightly more — 9% — do the same on their phones.
- Moderate screen time shows a stark contrast: 22% use computers for 1–3 hours, whereas phone usage in that range jumps to 45%.
- The most common range for computer use is 3–8 hours daily, reported by 47% of users, while 36% spend this much time on their phones.
- Extended usage is more typical on desktops: 26% spend over 8 hours a day on a computer, compared to just 10% who do so on their phones.
Technology Addiction Prevalence Data
Technology addiction is no longer a fringe concern. In 2025, it is increasingly recognized by healthcare providers as a behavioral disorder with physical, emotional, and cognitive consequences, especially among younger demographics.
- 36% of US adults admit they feel anxious or irritable without their smartphones.
- 1 in 4 teens spends more than 8 hours/day on social media, with difficulty cutting back.
- 62% of Gen Z users say they have tried (and failed) digital detoxing in the past year.
- Screen usage among children aged 5–10 has grown by 28%, with many displaying addictive behaviors.
- 42% of adults report checking their phones during meals or while socializing in person.
- Gaming disorder affects 5.7% of global players, with US rates reaching 6.2% in 2025.
- Smartphone overuse is now linked to higher cortisol levels, increased stress, and emotional reactivity.
- Only 15% of employers provide training or resources to help workers manage digital overload.
- People with tech addiction tendencies are 2.3x more likely to experience sleep, mood, and focus problems.
- Digital rehab centers and screen-time therapy programs have grown by 19% year over year.
Health Issues Linked to Smart Technology Use
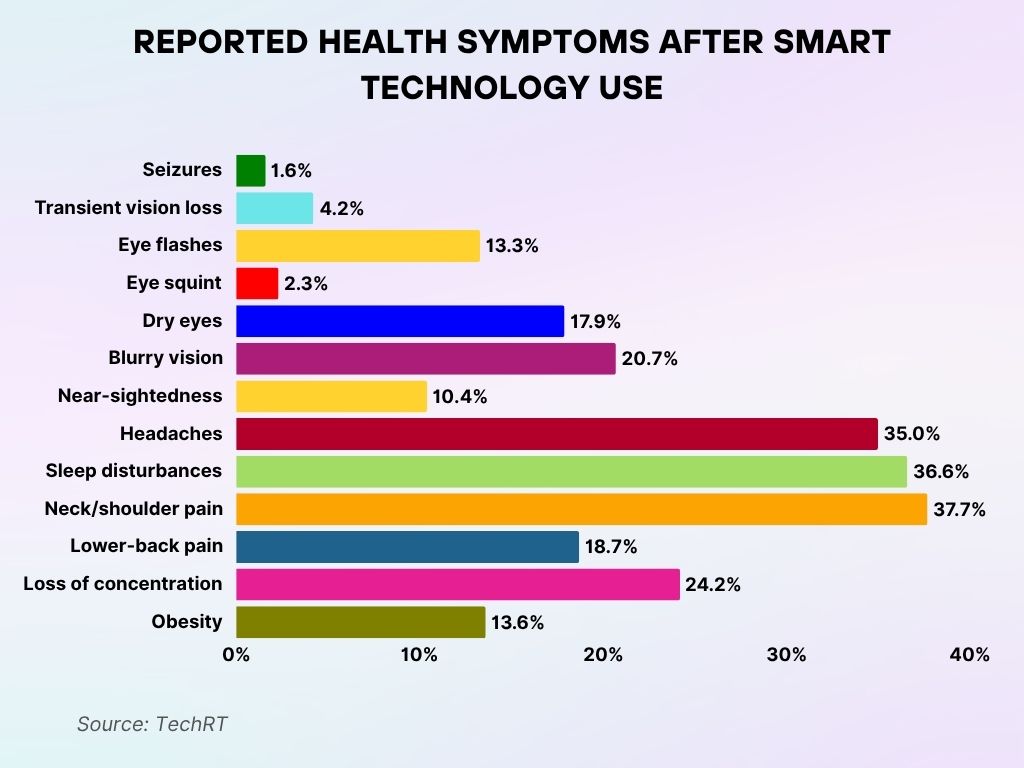
- The most frequent complaint among users was neck and shoulder pain, reported by 37.7%, pointing to common postural strain.
- Sleep disturbances followed closely, affecting 36.6%, showing how screens may interfere with rest and recovery.
- Headaches, a clear neurological concern, were experienced by 35% of respondents.
- A notable 24.2% said they suffered from loss of concentration, suggesting tech use may impair mental clarity.
- Blurry vision was another common issue, affecting 20.7%, likely tied to extended screen exposure.
- Lower-back pain came in at 18.7%, reinforcing physical strain as a recurring theme.
- Dry eyes, reported by 17.9%, are possibly linked to infrequent blinking during screen use.
- Obesity was mentioned by 13.6%, potentially connected to sedentary behavior caused by prolonged tech interaction.
- Eye flashes — a possible sign of screen-induced fatigue — were reported by 13.3%.
- Near-sightedness affected 10.4%, raising concerns about long-term vision effects.
- Though less common, transient vision loss still affected 4.2%, a symptom that shouldn’t be overlooked.
- Eye squinting was reported by 2.3%, possibly from trying to focus on small or bright screens.
- Finally, seizures were the rarest health issue, occurring in just 1.6% of users, but remain a serious health signal when they do appear.
Environmental Impact of Technological Waste
The lifecycle of our gadgets, from production to disposal, continues to leave a significant mark on the environment. E-waste is the fastest-growing type of waste in the US, driven by rapid device turnover and poor recycling practices.
- The US generated over 7.6 million metric tons of e-waste, projected to exceed 8 million tons in 2025.
- Only 17.4% of e-waste is formally recycled; the rest ends up in landfills or incinerators.
- Smartphones and tablets account for over 38% of small device waste.
- Data centers contribute to 2.1% of US electricity usage, with rising demand from AI and cloud services.
- Toxic metals like lead, mercury, and cadmium in old electronics are a public health risk in low-income recycling regions.
- Fast tech upgrades contribute to an average device replacement cycle of 22 months, down from 28 months in 2020.
- Improper disposal of lithium batteries causes over 1,200 fires annually in recycling and waste facilities.
- Manufacturing a single laptop consumes roughly 200,000 liters of water, highlighting the hidden costs of tech consumption.
- Green e-waste solutions are used by less than 9% of US households despite available options.
- Consumer awareness campaigns have led to only a 6% increase in responsible disposal behavior.
Generational Concerns About Social Media’s Health Impact
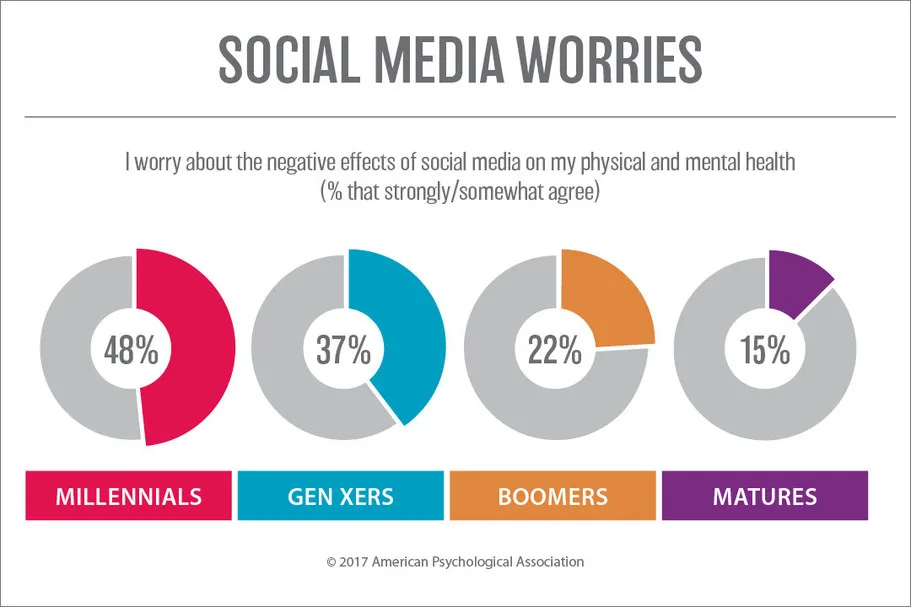
- Millennials lead the way in concern, with 48% expressing worry over how social media may harm their mental and physical health, the highest across all age groups.
- Close behind, 37% of Gen Xers also share this concern, showing significant unease about social media’s effects on well-being.
- In contrast, only 22% of Boomers feel the same, indicating a more relaxed attitude toward potential health risks.
- At the other end of the spectrum, just 15% of Matures report concern, making them the least affected group in terms of perceived social media harm.
Recent Developments
Several developments in 2025 reflect growing awareness and action, but also new complexities surrounding technology’s downside. Regulations, innovations, and public attitudes continue to evolve.
- The US Surgeon General has issued updated guidelines on screen time and mental health for children and adolescents.
- California passed new legislation requiring tech companies to include mental wellness warnings in high-use apps.
- Apple and Samsung launched built-in screen-time balance features focused on sleep-first design principles.
- Digital wellbeing dashboards are now standard on 72% of new Android and iOS devices.
- Tech-free schools are expanding, with over 800 public schools implementing device-free classroom policies.
- Workplace mindfulness apps saw a 22% increase in enterprise adoption to combat screen fatigue.
- Social media fatigue has led to an 11% decline in daily active use across some platforms.
- Companies offering “digital sabbaticals” have grown by 31% as part of employee wellness programs.
- AI-driven parental control tools are now more adaptive, allowing real-time usage tracking and health insights.
- Experts now warn that overdependence on wearable health devices may ironically cause more stress and compulsive behavior.
Conclusion
Technology is embedded in every part of modern life, and that’s not changing anytime soon. But as 2025 data shows, our digital lifestyles are coming at a cost: to our sleep, our bodies, our mental health, and even the planet. This article isn’t an argument against innovation, it’s a call to reassess how we use tech, especially when convenience turns into compulsion.
From rising cyberbullying rates to soaring e-waste volumes, the statistics underscore a pressing need: for healthier habits, smarter design, and more accountability from both users and creators. The goal isn’t to unplug entirely, but to plug in with more purpose, balance, and awareness.


Leave a comment
Have something to say about this article? Add your comment and start the discussion.