It’s 6:30 a.m. when Maya’s smart alarm gently nudges her awake. Her smartwatch tracks her pulse as she stretches, the coffee maker starts brewing automatically, and her phone already has today’s headlines tailored to her interests. This isn’t science fiction, it’s just a regular Tuesday in 2025.
From telehealth appointments to AI-driven content, technology is seamlessly woven into our routines. But how much are we using, and is it making life better, or just busier? This article unpacks the latest statistics on how tech is shaping daily life across sectors and age groups.
Editor’s Choice
Here are seven standout statistics that define tech usage in 2025:
- The average American now spends 8.1 hours per day on digital devices.
- Gen Z leads all age groups, with 11.3 hours of daily screen time, blending productivity, education, and entertainment.
- 87% of U.S. hospitals now use AI-powered diagnostics.
- Wearable tech adoption has hit 54% of U.S. adults, driven by health-conscious behaviors and employer wellness programs.
- Gaming platforms saw a 12% increase in daily active users, with 4 in 10 Americans identifying as regular gamers.
- Contactless payments now account for 68% of in-person transactions across the U.S.
- 84% of digital creators under age 35 earn income through at least two platforms, showcasing the rise of multi-platform monetization.
How Restaurants Are Using AI to Streamline Operations
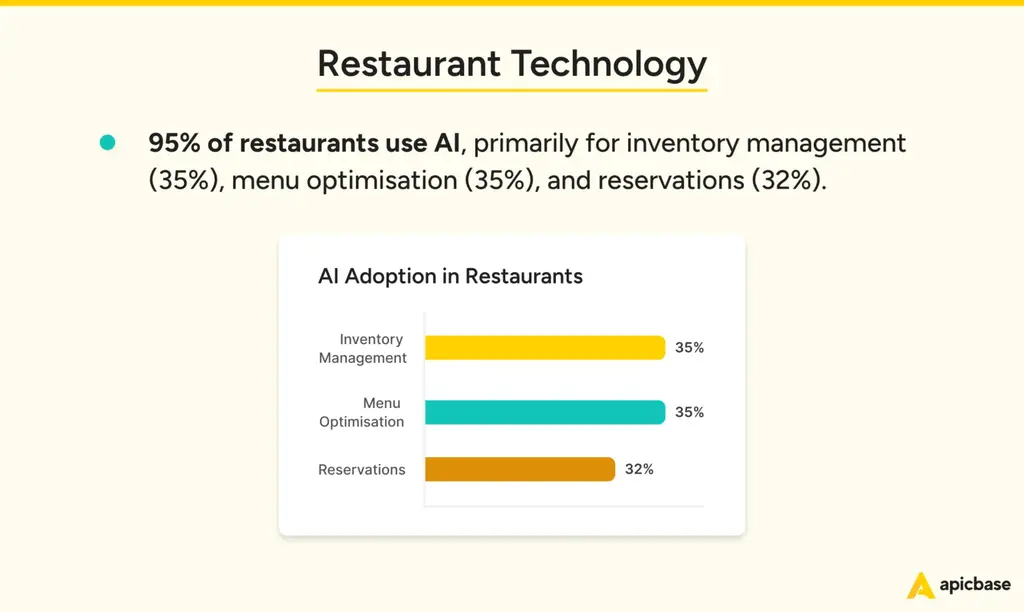
- AI is now mainstream in food service, with 95% of restaurants integrating it into daily operations for greater efficiency.
- 35% use AI to manage inventory smartly, reducing waste and maintaining optimal stock levels.
- Another 35% apply AI to fine-tune menus, aligning offerings with customer preferences and trends.
- 32% have automated reservations using AI, boosting both booking accuracy and customer satisfaction.
Daily Screen Time Across Age Groups
- Adults aged 18–24 average 11.3 hours of screen time per day, with nearly half of that spent on mobile devices.
- Children aged 5–12 spend 5.2 hours daily, with 64% of that time on educational platforms or gaming apps.
- Seniors (65+) now clock 4.7 hours/day, driven by digital health services and social apps.
- Millennials (25–40) spend about 9.4 hours daily, primarily split between work tools and streaming content.
- Smartphone screen time now accounts for 56% of all device interaction time, with laptops and tablets making up the rest.
- 44% of Americans check their devices within 5 minutes of waking up, with that figure rising to 71% for Gen Z.
- Parents report a 17% increase in screen-related conflicts at home, as remote learning and screen fatigue blur boundaries.
- Digital wellbeing app usage has grown by 29% YoY, reflecting growing concern over screen addiction.
- Among high school students, screen time jumped to 7.6 hours/day, with social media occupying 3.1 hours on average.
- Nearly 1 in 3 U.S. households has instituted daily screen time limits via parental control tools or app restrictions.
- Voice-activated assistants are used by 72% of Gen X and Millennials daily, often replacing the need for visual screen time.
Technology Usage in Healthcare Systems
- 87% of hospitals in the U.S. have integrated AI tools for radiology, triage, or patient flow optimization.
- Telemedicine accounts for 42% of outpatient consultations in early 2025, holding steady after rapid pandemic-era growth.
- EMR (Electronic Medical Record) usage is at 98% adoption in public healthcare facilities nationwide.
- 65% of Americans over 50 have used a patient portal in the past year.
- Remote patient monitoring tools are in active use for 27 million Americans, primarily for chronic conditions like diabetes and heart disease.
- Mental health apps now serve over 60 million users in the U.S., with Gen Z being the most active demographic.
- AI triage bots handle 38% of preliminary health queries on major U.S. insurance and hospital networks.
- Prescription automation tools reduce refill errors by 22% and are now used by 68% of retail pharmacies.
- Blockchain-based health records pilot programs are active in 12 states, focusing on portability and data privacy.
- Digital therapeutics platforms (e.g., for ADHD, insomnia, or anxiety) are FDA-approved and used by 7.3 million people.
- Smart hospital rooms, equipped with IoT monitors and predictive analytics, are now featured in 19% of new hospital constructions.
Top Tools Powering DevOps Workflows
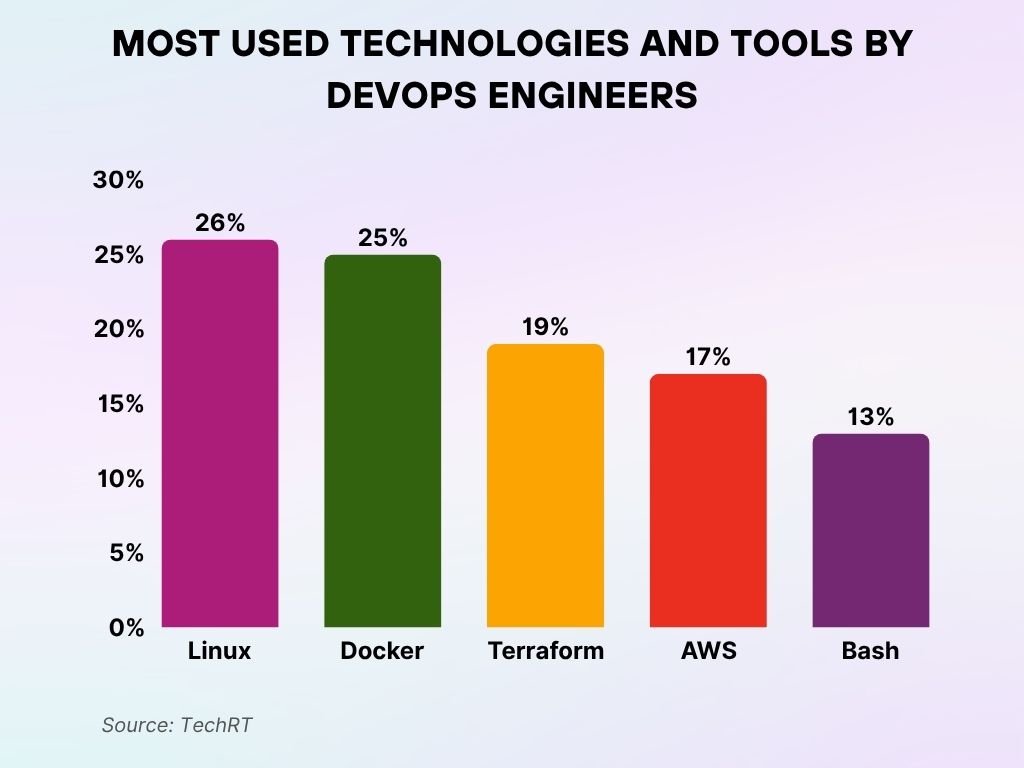
- Linux leads the pack, with 26% of DevOps engineers relying on it as their go-to environment.
- Docker comes in strong at 25%, showing just how essential containerization has become in modern development.
- Terraform is used by 19%, underlining the rise of infrastructure as code in scalable deployments.
- AWS holds a 17% share, confirming its role as a dominant force in cloud computing for DevOps teams.
- Bash remains relevant, with 13% still using it for critical scripting and automation tasks.
Growth of Wearable Tech and Fitness Devices
- 54% of U.S. adults now own a wearable device, with smartwatches being the most common.
- Heart rate monitoring is the most-used feature, followed by sleep tracking and step counting.
- Fitness wearables are used by 61% of Millennials, while Gen Z usage has grown to 58%.
- Corporate wellness programs have integrated wearables in 38% of U.S. companies, offering health incentives for activity levels.
- Smart rings and biosensors are gaining traction, especially in high-performance training and medical use cases.
- Wearables with ECG and blood oxygen sensors account for 41% of new smartwatch sales in 2025.
- Women-specific wearables focused on cycle tracking and hormone monitoring have grown by 35% YoY.
- Children’s smartwatches, with GPS and safety features, are used by 1 in 6 families with children under 13.
- Healthcare-approved wearables are covered under insurance in 14 U.S. states as part of preventative care.
- Google Fit and Apple Health report a 30% surge in weekly active users, especially among users aged 30–49.
- Voice-enabled fitness assistants, such as those in Amazon Halo and Whoop, are now used by 24% of wearable owners.
Gaming and Entertainment Technology
- 4 in 10 Americans identify as regular gamers, with an average daily gaming time of 1.9 hours.
- Mobile gaming makes up 54% of all gaming activity, followed by console (28%) and PC (18%).
- Cloud gaming adoption has tripled since 2022, with services like Xbox Cloud Gaming and NVIDIA GeForce Now gaining over 15 million U.S. users.
- VR headset usage has reached 32 million U.S. users, with top genres being first-person shooters, fitness, and simulation.
- Esports streaming viewership is up 18% YoY, with Twitch and YouTube Gaming leading with over 105 million monthly viewers combined.
- Gamers aged 45+ now represent 14% of the market, often favoring puzzle, simulation, and strategy games.
- Digital collectibles and in-game purchases account for $23 billion in spending, driven heavily by Gen Z players.
- Parental control usage in gaming platforms has grown by 21%, with real-time activity dashboards now common.
- Cross-platform play is a key feature in 76% of newly released games in 2025.
- AI-driven game design tools are now used by 38% of indie developers to create characters, environments, or dialogue.
- Metaverse-style platforms, such as Roblox and Fortnite Creative, engage more than 70 million daily players globally.
How Customers Prefer to Communicate
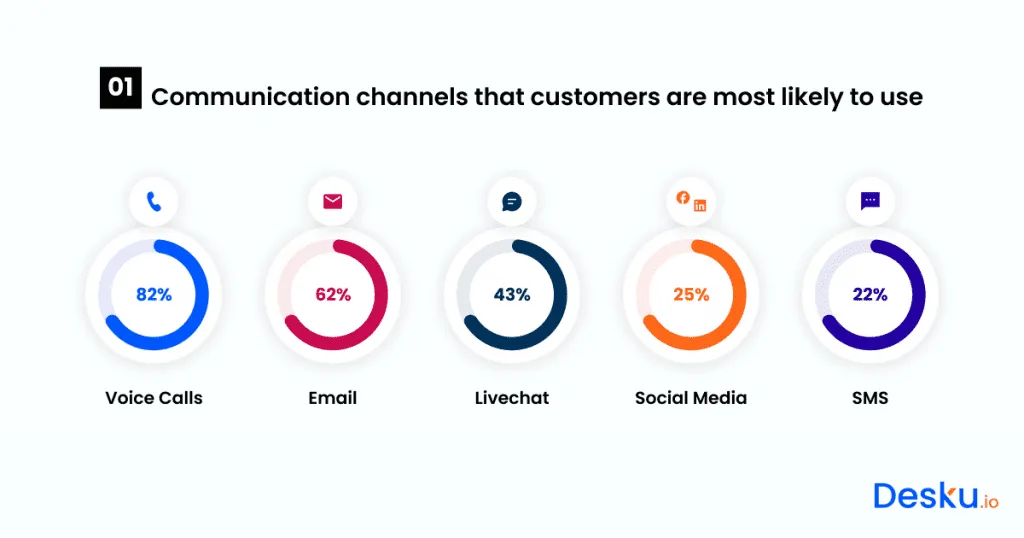
- Voice calls remain king, with 82% of customers choosing them as their top communication method.
- Email stays strong at 62%, proving it’s still a trusted way to connect with brands.
- Live chat appeals to 43%, showing a clear preference for real-time assistance.
- 25% of customers reach out via social media, blending support with their daily online activity.
- SMS trails behind, used by just 22%, but is still relevant for quick, direct updates.
E-commerce and Digital Payment Technology Trends
- 68% of U.S. in-person transactions are now done via contactless payments, including NFC cards, phones, and smartwatches.
- Buy Now, Pay Later (BNPL) services are used by 43% of online shoppers aged 18–34, particularly for fashion and electronics.
- Voice commerce sales are expected to surpass $31 billion in the U.S. in 2025.
- QR code payment adoption has doubled in the U.S. since 2021 and is now standard at 53% of small retail outlets.
- Subscription-based shopping models (e.g., for food, fashion, and pet supplies) account for 19% of total e-commerce spend.
- Digital wallets (like Apple Pay, PayPal, and Google Pay) are now used by 81% of Americans, a rise of 12% YoY.
- E-commerce revenue in the U.S. is projected to hit $1.4 trillion in 2025, driven by mobile-first platforms and influencer marketing.
- AI-powered product recommendation engines now drive over 35% of conversions for major retailers.
- Cart abandonment rates are at 69%, but real-time personalization tools help recover 1 in 5 abandoned carts.
- Social commerce transactions through platforms like Instagram and TikTok make up 22% of all mobile sales.
- Green commerce is emerging fast; 1 in 3 shoppers under age 30 prefer brands offering carbon-neutral shipping options.
Use of Technology in Government Services
- 81% of Americans interacted with at least one digital government service in the past year, mostly for taxes, permits, or benefits.
- Real-time tax filing portals now serve 42 states, reducing average refund processing time by 37%.
- Digital driver’s licenses and ID cards are accepted in 28 U.S. states and integrated with mobile wallets.
- AI chatbots are deployed in over 75% of federal and state websites to manage citizen inquiries.
- Mobile voting pilot programs are active in 6 states, using blockchain for verification and transparency.
- e-Notary services have expanded to 39 states, used for legal, real estate, and corporate documents.
- Municipal IoT sensors monitor traffic, pollution, and energy use in over 200 U.S. cities.
- Digital SNAP and EBT cards are now usable via mobile apps in most states, improving access and reducing fraud.
- Open data portals are available in all 50 states, offering public access to government datasets on topics from housing to health.
- Cloud migration across federal systems is 86% complete, improving uptime and cross-agency data sharing.
- Cybersecurity budgets for government IT departments increased by 19% YoY, reflecting growing threats and critical infrastructure dependence.
Where Voice Technology Is Making the Most Noise
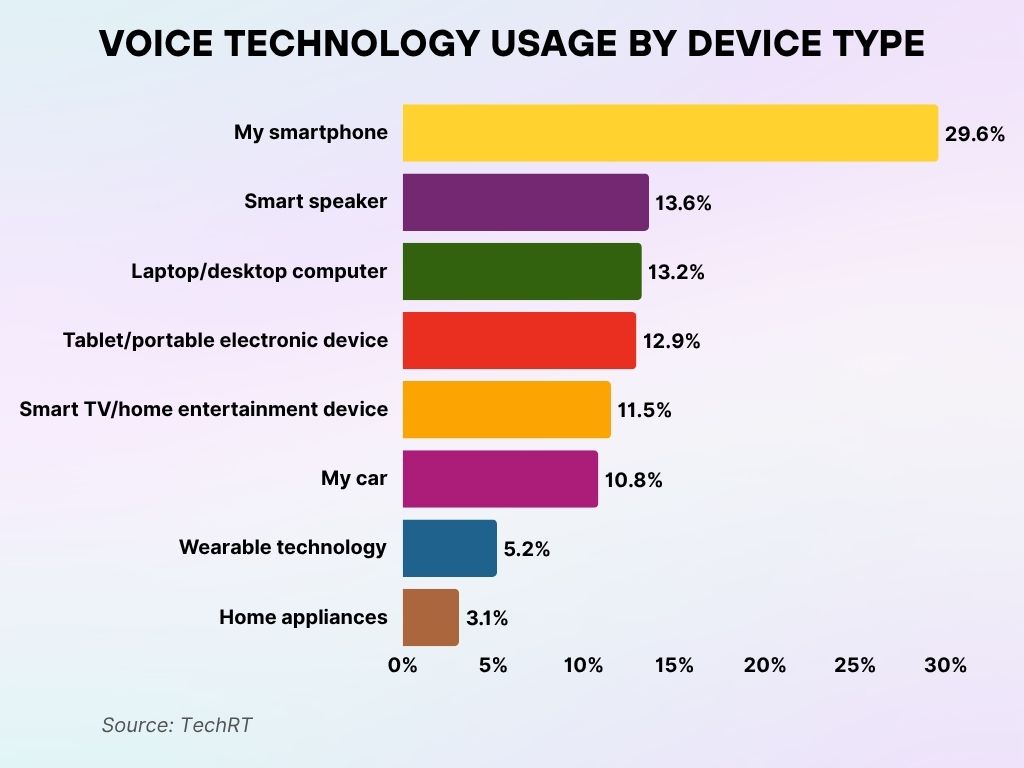
- Smartphones dominate, driving 29.6% of all voice tech interactions, making them the top device for voice commands.
- Smart speakers hold 13.6%, reflecting their growing role in hands-free home control.
- Laptops and desktops contribute 13.2%, showing that voice tech is catching on in traditional work setups.
- Tablets and portable devices follow at 12.9%, offering convenient on-the-go voice functionality.
- Smart TVs and entertainment systems account for 11.5%, bringing voice into the living room experience.
- Cars with voice assistants make up 10.8%, highlighting increasing use while driving.
- Wearables, like smartwatches, are used in 5.2% of interactions, small but growing.
- Home appliances are just starting to join the trend, with 3.1% of voice tech usage.
Trends in Digital Content Creation and Consumption
- Over 210 million Americans consume digital content daily, with video accounting for 74% of all online traffic.
- Short-form videos dominate, with TikTok, YouTube Shorts, and Instagram Reels capturing 62% of mobile watch time.
- Podcasts now reach 48% of U.S. adults weekly, with true crime and health being the most popular genres.
- The content creator economy is valued at $183 billion globally, with the U.S. contributing nearly 32% of that figure.
- 45% of creators under 35 now earn at least $50,000/year through affiliate marketing, subscriptions, and brand partnerships.
- AI-powered tools like Jasper, Descript, and Canva AI are used by 61% of creators for scripting, editing, and design.
- Livestreaming engagement rose by 21%, with platforms like Twitch and TikTok LIVE seeing sharp upticks in real-time viewer interactions.
- Digital reading apps like Kindle and Scribd are used by 1 in 4 U.S. adults, especially those aged 30–49.
- Educational content makes up 17% of YouTube’s U.S. traffic, with topics ranging from DIY to financial literacy.
- Creators publishing across 3+ platforms increased by 33%, with cross-posting seen as essential for growth and resilience.
- Digital tipping and fan monetization features (e.g., Buy Me a Coffee, Patreon) have grown in popularity by 28% YoY.
Workplace Automation and Digital Tools Adoption
- 72% of U.S. businesses now rely on automation or AI tools to handle routine tasks like scheduling, invoicing, or support.
- AI adoption in enterprise settings jumped to 65% in 2025, especially in marketing, finance, and HR.
- Remote work remains standard for 41% of U.S. professionals, with hybrid models in place at over 60% of companies.
- Slack, Microsoft Teams, and Zoom are active in 89% of organizations, with Slack usage up 12% YoY.
- Employee productivity monitoring software is used by 44% of employers, sparking increased dialogue about privacy and transparency.
- Low-code/no-code platforms are now part of 47% of IT departments’ workflows, especially for building internal tools.
- Automation bots handle 23% of customer service tasks across sectors like retail, healthcare, and banking.
- Digital HR platforms, such as BambooHR and Workday, are used by over 78% of mid-to-large U.S. companies.
- AI-assisted recruitment tools are involved in 58% of all job application screening processes.
- Task management software like Asana and Trello saw a 15% increase in enterprise adoption this year.
- Cybersecurity automation systems, especially for threat detection, are now deployed in 52% of Fortune 1000 companies.
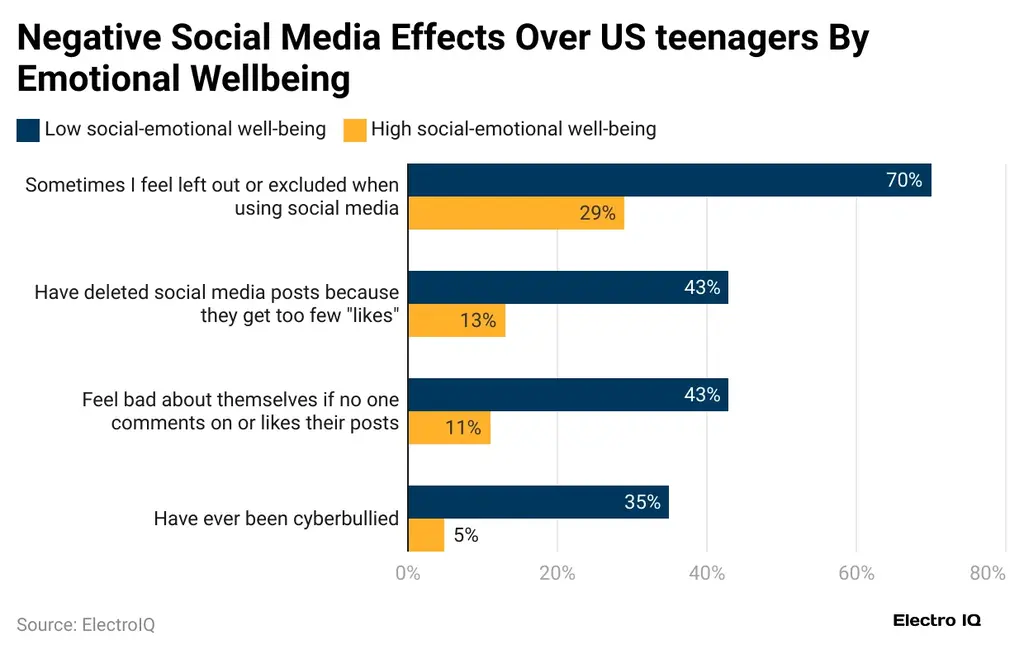
The Emotional Toll of Social Media on U.S. Teens
- 70% of teens with low emotional well-being feel left out or excluded on social media, far higher than the 29% of teens with higher well-being.
- 43% of struggling teens delete posts that don’t get enough “likes,” compared to just 13% of emotionally healthy peers.
- Nearly half (43%) of low well-being teens feel bad about themselves when posts get no interaction, versus only 11% of high well-being teens.
- Cyberbullying affects 35% of teens with poor emotional health, while just 5% of those with higher well-being report the same experience.
User Concerns About Technology Overuse
- 62% of U.S. adults report feeling “somewhat” to “very” overwhelmed by the amount of time they spend on devices.
- Digital detox attempts are up 18% in 2025, with weekends and vacations being the most common break periods.
- 58% of parents are concerned about tech overuse among children under 18, with screen time and social media topping the list.
- Mental health professionals report a 26% increase in clients citing tech addiction or screen-related stress.
- Sleep disruption due to screen exposure affects 41% of adults, with blue light reduction apps in high demand.
- 53% of surveyed Gen Z users admit to experiencing “scroll fatigue” daily, particularly on social platforms.
- One-third of American workplaces now include digital wellness modules in onboarding and training programs.
- Tech-free zones and hours have been implemented in 24% of U.S. households, often focused on dining and bedtime routines.
- AI-generated misinformation and overexposure to digital content are leading concerns among young voters in 2025.
- Mindfulness app usage like Calm and Headspace is up 22% YoY, often paired with screen time trackers.
- 37% of users aged 50+ express a desire for simpler digital interfaces to combat cognitive overload.
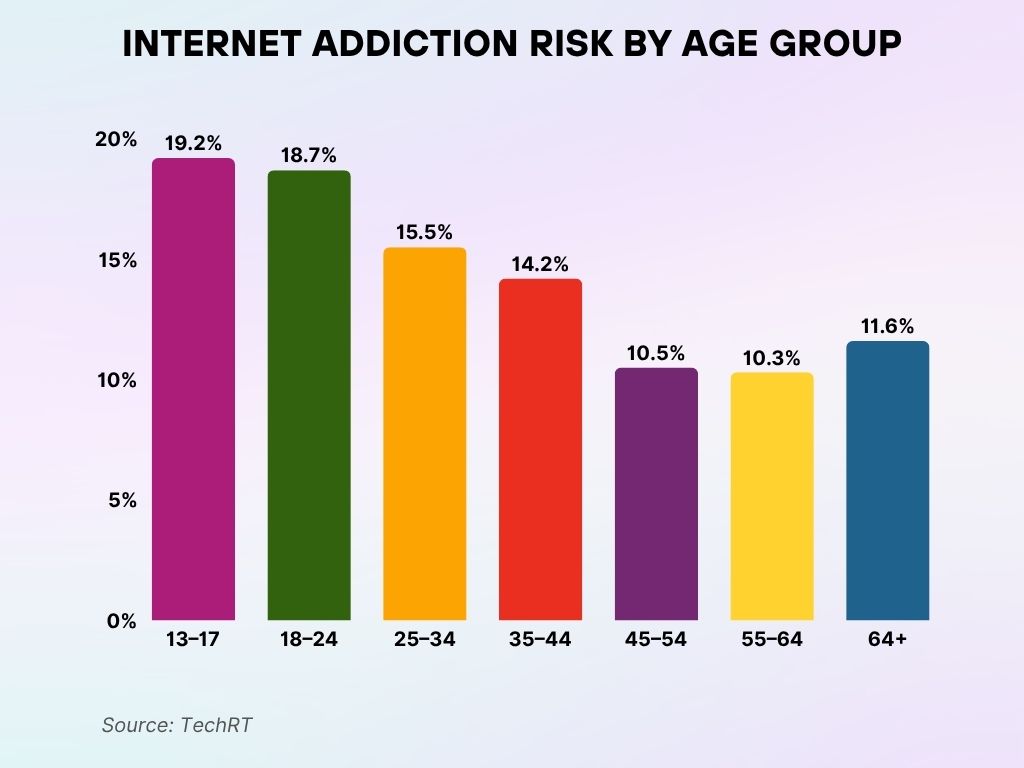
Which Age Groups Face the Highest Risk of Internet Addiction?
- Teens (13–17) top the list, making up 19.2% of the total internet addiction risk, the most vulnerable group.
- Young adults (18–24) follow closely at 18.7%, showing continued high risk during the transition to adulthood.
- Early adults (25–34) contribute 15.5%, reflecting elevated digital dependency in this age group.
- Midlife adults (35–44) come in at 14.2%, signaling a slow but steady decline in risk with age.
- Adults aged 45–54 account for 10.5%, with risk levels tapering off.
- Older adults (55–64) represent 10.3%, showing moderate exposure to digital overuse.
- Surprisingly, seniors 65+ make up 11.6%, a figure that’s higher than some middle-aged groups.
Recent Developments in Technology Usage
- AI-generated content is now integrated into 45% of websites, from product descriptions to blog writing and image creation.
- 5G penetration in the U.S. has reached 91% of the population, drastically improving mobile experience in urban and rural areas alike.
- Digital twins, used in engineering, health, and urban planning, are active in more than 120 municipal and corporate pilots.
- Ambient computing, including always-on voice assistants and passive sensors, is embedded in 35% of U.S. smart homes.
- Edge computing applications are scaling across retail and manufacturing, reducing cloud latency by up to 45%.
- Robotic process automation (RPA) handles over 350 million tasks/month across finance and HR departments nationwide.
- AI image and video generation tools, like Sora and Midjourney, are now mainstream among designers and marketers.
- U.S. smart city initiatives expanded in 2025, with $12.6 billion in federal grants targeting energy, transit, and surveillance upgrades.
- Neural interface devices are in early consumer testing phases, with FDA-approved clinical uses expected by 2026.
- Sustainable tech solutions, such as energy-efficient chips and solar-powered wearables, are gaining traction across categories.
- AI co-pilot features are now baked into Microsoft 365, Google Workspace, and Adobe Creative Cloud, automating up to 35% of routine user tasks.
Conclusion
From screen fatigue to surgical precision, technology in 2025 continues to weave itself into the core of human experience, with all its efficiencies, opportunities, and ethical dilemmas. As Americans juggle convenience and concern, the data shows clear momentum: more automation, more personalization, and a growing need for balance.
Whether you’re tracking steps, managing remote teams, or simply streaming your favorite show, chances are you’re part of the statistical story of tech adoption. And if this year’s numbers are any sign, the digital world is just getting warmed up.



Leave a comment
Have something to say about this article? Add your comment and start the discussion.