



The Android launcher market is a niche but vital part of the broader Android ecosystem. Launchers control the home screen look and feel, influence productivity, and shape how millions of users interact with their devices daily. The Android OS still dominates global smartphone usage, maintaining roughly 72–73% market share worldwide, and supporting billions of active users, creating a large base for launcher adoption.
Real-world impact: In enterprise settings, customized launchers help streamline workflows on employee devices. In consumer markets, launchers such as Nova Launcher and Niagara Launcher are key favorites for personalization and performance enhancements. Explore the following sections to understand key trends, user behavior, and market movement shaping Android launchers.
Editor’s Choice
- Android holds around 72–73% of global mobile OS share in 2025, powering billions of active devices.
- The Android user base grew roughly 8% year‑over‑year from 2024 to 2025.
- The Android Launcher market reached an estimated $42.2M in 2024.
- CAGR forecast through 2031 is negative (~‑7.8%), indicating contraction.
- Third‑party launchers remain popular with millions of installs despite OEM defaults.
- Compatibility with Android 16 improved launcher stability in 2025.
- Customization preference remains a top driver for launcher installation (Nova, Niagara, Hyperion).
Recent Developments
- Android 16 has improved third‑party launcher compatibility, reducing historical UI issues.
- Many users on newer OEM devices report significantly smoother launcher performance in 2025.
- Nova Launcher’s development faced major disruption with layoffs and founder departures, impacting future updates.
- Alternative launchers like Niagara and Hyperion saw heightened attention after Nova’s uncertain future.
- Launchers are increasingly integrating AI‑driven suggestions and smart folder sorting features.
- OEM enhancements to native launcher APIs have improved gesture support and customization stability.
- Some launchers now offer performance‑boosting tools that help optimize battery usage and animations.
- App personalization trends have pushed launcher designers to innovate layout and theme features.
Overview of statistics in the Android Launcher market
- The global Android Launcher market was valued at roughly $42M in 2024–2025.
- Forecasts project the market to shrink to around $24.1M by 2031.
- Annual growth rates remain modest or negative, unlike broader Android app segments.
- Third‑party launcher downloads remain strong on Google Play, with top launchers in millions of installs.
- Daily active usage metrics vary widely between launchers, with top ones consistently in personalization rankings.
- Launchers contribute a small but measurable share of mobile personalization app installs.
- Consumer preference for customization is a major adoption driver in markets like the US and Europe.
- OEM default launchers still capture most daily launcher interactions on Android devices.
Android Launcher Market Size Trend (2025–2033)
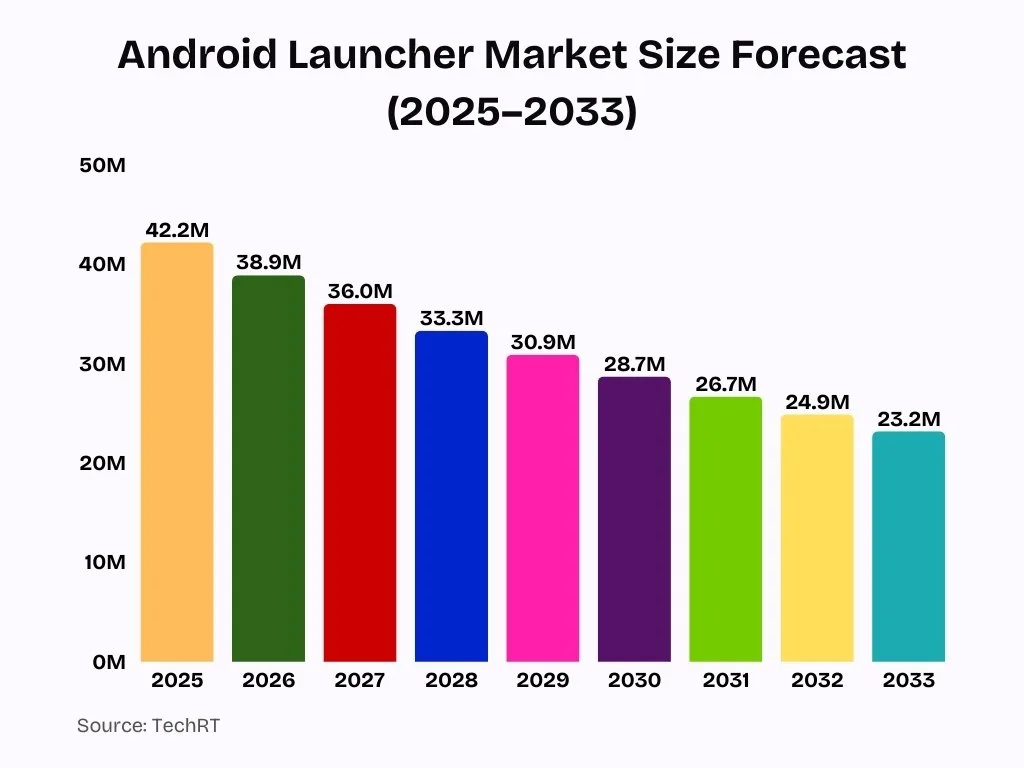
- The Android launcher market is projected to start at 42.2 million users in 2025, marking the peak adoption level in the forecast period.
- Market size is expected to decline to 38.9 million in 2026, showing an early sign of slowing user growth.
- By 2027, the user base is estimated to fall further to 36.0 million, reflecting reduced demand for third-party launchers.
- The market is forecast to shrink to 33.3 million users in 2028, indicating continued gradual contraction.
- In 2029, Android launcher usage is projected at 30.9 million, crossing below the 31 million threshold.
- The downward trend continues in 2030, with market size declining to 28.7 million users.
- By 2031, active users are expected to decrease to 26.7 million, highlighting sustained market saturation.
- The market is forecast to reach 24.9 million users in 2032, driven by increased default launcher optimization.
- By 2033, Android launcher size is projected to drop to 23.2 million, representing an overall decline of ~45% from 2025 levels.
User adoption rates across Android Launchers
- Android devices reached approximately 3.9 billion users worldwide in 2025, up about 8% year‑over‑year from 2024, showing broad OS adoption that fuels launcher usage potential.
- Android maintains around 72–73% share of the global mobile OS market in 2025, indicating a large addressable user base for launcher apps.
- In the U.S., Android holds roughly 41–42% mobile OS share in 2025, where launcher adoption often correlates with regional customization preferences.
- Nearly 4.7 billion people globally use smartphones in 2025, highlighting continued growth in mobile engagement where launchers operate.
- Around 88% of users actively engage with smartphones daily, showing frequent opportunities for launcher interaction.
- Custom launcher installs are driven by personalization preferences, especially for power users seeking tailored interfaces.
- Despite strong Android OS penetration, third‑party launcher adoption rates vary widely by region and user segment.
- Users adopting minimalist or performance‑oriented launchers often cite faster navigation and reduced UI clutter.
Active users by year using Android Launchers
- Android OS grew its user base from roughly 3.6 billion in 2024 to ~3.9 billion in 2025.
- Daily smartphone usage among users worldwide averages over 5 hours per day, indicating a high engagement context for launcher activity.
- While specific launcher active users aren’t measured publicly, top launchers each boast millions of installs on Google Play.
- Install growth for customization tools (including launchers) generally aligns with overall app growth in 2025.
- Active launcher sessions tend to spike on devices where users customize home screens for productivity or style.
- Third‑party launcher usage rates increased in 2025 due to improved Android support, easing past UI issues.
- Aging devices often retain higher active launcher usage as users seek performance enhancements.
- Regions with large Android penetration see more consistent launcher active users year over year.
Market share trends by type of Android Launcher
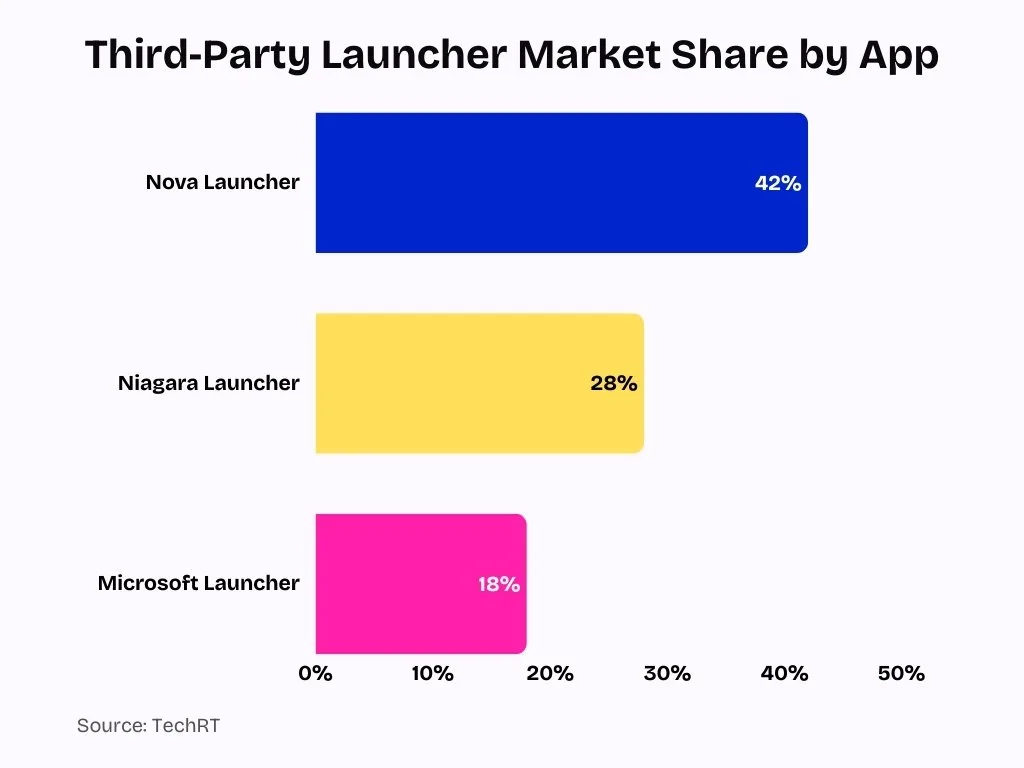
- Customization-focused launchers like Nova and Niagara hold 42% and 28% of third-party market share, respectively.
- Minimalist launchers such as Olauncher saw 200% YoY download growth among privacy seekers.
- Microsoft Launcher commands 18% share via strong cross-platform ecosystem integration.
- OEM launchers from Samsung and Pixel dominate with 84% of total active Android usage.
- Smart launchers with AI widgets report 20-30% higher engagement growth in 2025.
- Static theme-only launchers lag with slower adoption versus gesture-driven alternatives.
- Advanced performance launchers gain traction among power users amid rising customization demands.
- Privacy-centric launchers maintain a niche but loyal segment with millions of downloads.
Usage trends by Android OS version and Launcher type
- Android 13–15 combined cover over 52% of active devices, prioritizing launcher development focus.
- Android 16 reaches 7–10% adoption by year-end, boosting advanced launcher API support.
- Versions Android 12 and below represent ~38% fragmentation, causing inconsistent launcher performance.
- Customization launchers see 68% fewer critical issues on Android 15+ versus older versions.
- Minimalist launchers dominate mid-range devices with low RAM usage optimization trends.
- Smart launchers with AI features report doubled satisfaction to 47% on Android 15+.
- Third-party launcher market grows at 14.3% CAGR through 2032, fueled by gesture navigation.
- Stock vs custom launchers: Nova tops with millions of users, preferred on newer OS for animations.
Device‑specific patterns in Android Launcher usage
- The Android launcher market is valued at $47.76 million in 2023, projected to decline to $25.87 million by 2030 due to OEM improvements.
- Third-party launchers face 22% critical issues on average Android versions, dropping to 7% in 2025 surveys.
- Low-end devices (<3GB RAM) see Nova Launcher lag at 89% frame stability, while lightweight options hit 98%.
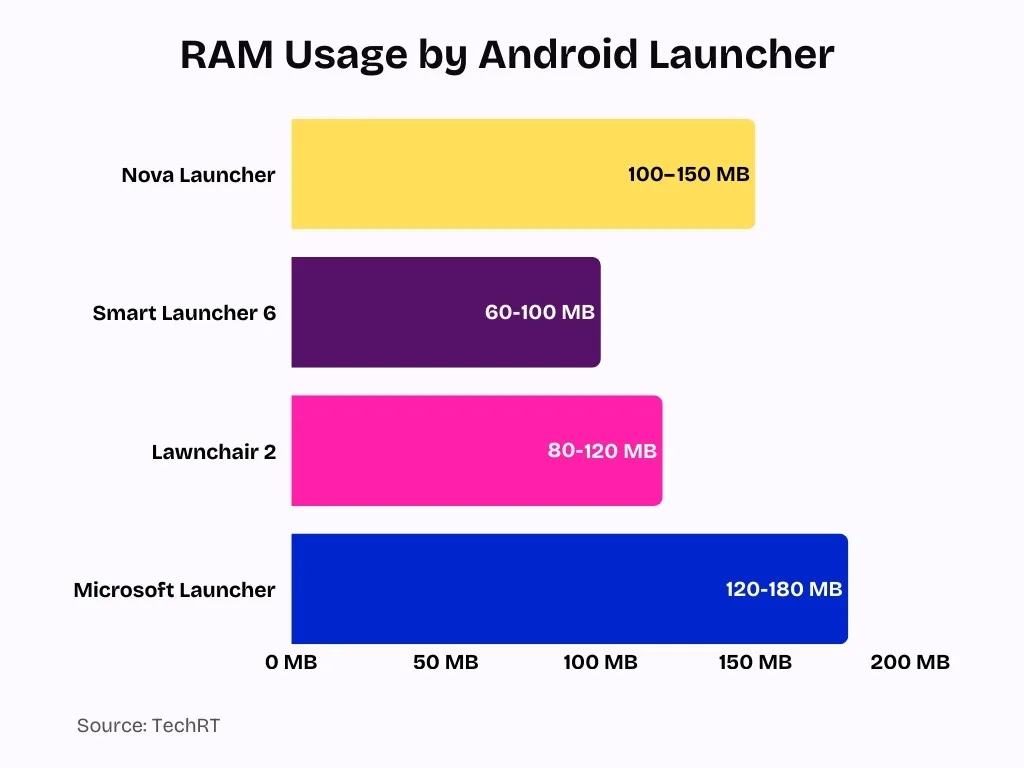
- Lawnchair uses 80-120MB RAM on average, outperforming Nova‘s 100-150MB by reducing battery drain 0.8-1.5% hourly.
- 70% app failures stem from Android fragmentation, impacting launcher animations and responsiveness across hardware.
- 47% users report no issues with third-party launchers in 2025, up from prior years amid better Android support.
- Olauncher consumes ultra-low RAM on older devices with a 2MB size, prioritizing speed over features.
- Asia-Pacific holds the largest launcher market share at $11.89 million in 2023, driven by a diverse low-spec Android ecosystem.
- KISS Launcher is ideal for low-end devices, using minimal resources for blazing search on 3-4GB RAM phones.
Gender demographics using Android Launchers
- In the U.S., 95% of females and 94% of males aged 16-64 own smartphones.
- Globally, women are 10% less likely to own mobile phones than men.
- Worldwide, 57% of Android users are male and 43% female.
- Females average 2 hours 47 minutes daily smartphone screen time vs. 2 hours 34 minutes for males.
- In the UK, women access an average of 39 mobile apps daily vs. 37 for men.
- No significant gender difference exists in adolescent smartphone usage hours.
- Cervically installed apps predict user gender with ~70% accuracy.
- Female teens launch apps 99 times daily on average.
- Preferences for Android launchers are driven more by style than gender.
Age‑wise segmentation of Android Launcher users
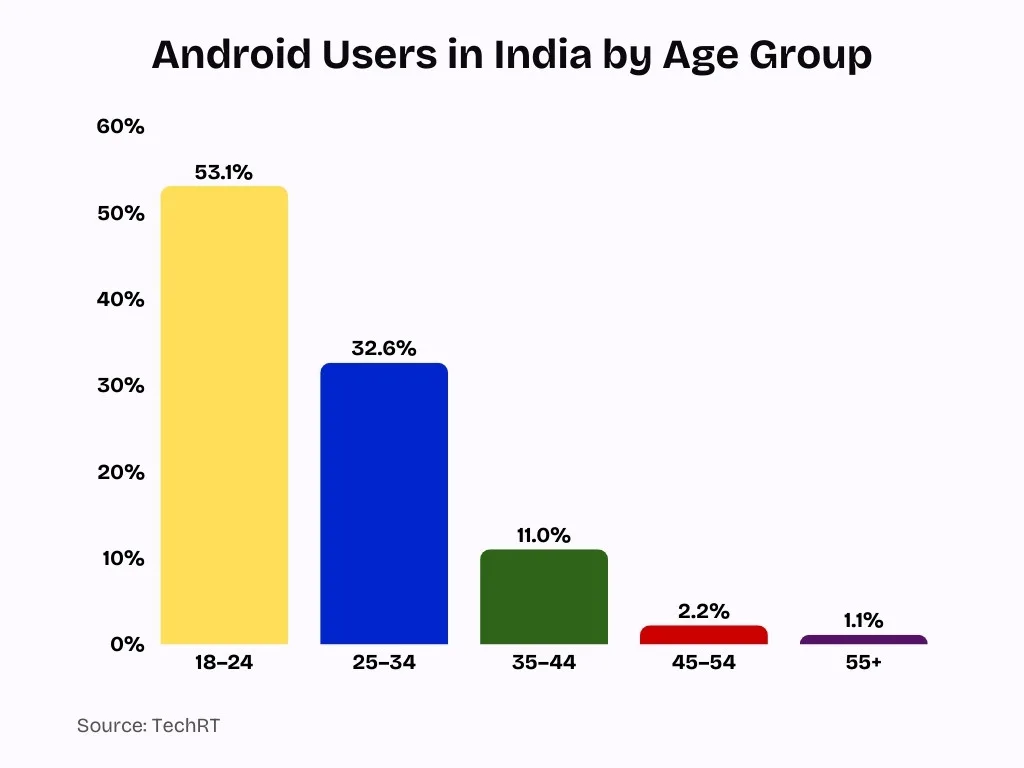
- Users aged 18–24 represent 53.1% of Android users in India, driving high launcher engagement.
- Individuals aged 25–34 account for 32.6% of Android smartphone users, favoring personalization.
- Users aged 35–44 make up 11% of Android users with moderate launcher interest for productivity.
- Android users aged 45–54 comprise 2.2%, showing limited custom launcher adoption.
- Those aged 55+ represent just 1.1% of Android users, preferring default simple launchers.
- Approximately 70% of 18–24-year-olds use Android, prioritizing customization in launchers.
- Around 80% of users over 50 want home screen customization, but 40% face icon association issues.
- Younger cohorts (18–34) comprise 65% of internet users, correlating with complex launcher preferences.
Installation and uninstallation behavior of Android Launcher users
- On average, Android users uninstall about 48% of the apps they install within 30 days, indicating high churn across mobile apps generally.
- Retention data shows average Android app retention of ~21.1% on day 1, falling to ~2.1% by day 30, underscoring challenges in keeping users engaged post‑installation.
- Launchers often use freemium models (free core features + paid customization add‑ons) to reduce uninstallation and boost long‑term use.
- Users install third‑party launchers primarily for customization or performance, but many revert to stock launchers when native Android features improve.
- Launchers with AI suggestions and smart features tend to maintain installs longer than basic alternatives.
- Install spikes often occur after major Android version releases as users explore new UI possibilities.
- Lower‑end devices see fewer launcher installs overall due to limited storage and performance constraints.
- Heavy personalization launchers can face higher uninstall rates if users find the UI too complex or battery‑intensive.
- In markets where OEM launchers have strong features, third‑party installs are comparatively lower.
Retention and churn metrics for Android Launcher users
- Apps with poor onboarding can lose up to 40–70% of new users within the first week, a challenge relevant to launchers as well.
- Retention strategies like personalization walkthroughs help launcher apps engage users beyond initial installation.
- High churn reflects users switching to stock or alternative launchers when updates lag or performance dips.
- Stronger engagement often links to useful Widgets and gesture shortcuts, features that encourage daily interactions.
- Retention at day 7 is typically a key performance predictor for mobile app longevity.
- Launcher developers use push notifications or suggestions to re‑engage dormant users.
- Churn analytics inform updates and feature priorities to improve user satisfaction.
- Continuous feature improvements can reduce churn rates over time by maintaining user interest.
Regional distribution in the Android Launcher market
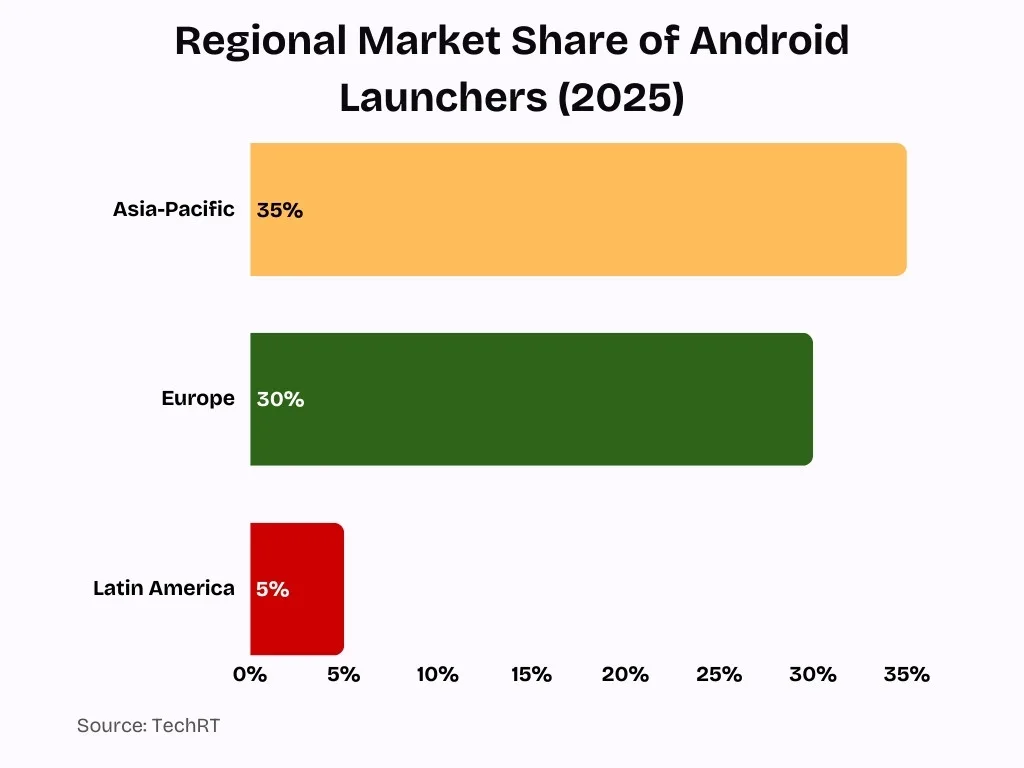
- APAC commands the largest share of the Android launcher market with a vast Android user base across India, China, and Southeast Asia.
- North America follows with strong demand from productivity-focused users and early AI-driven launcher adoption.
- The Asia-Pacific region leads 35% of the global Android launcher market share in 2025.
- Europe holds ~30% market share, showing balanced interest in OEM and third-party launchers.
- The US ranks high in Nova Launcher usage at #17 in the personalization category.
- Latin America contributes ~5% to the global market with rising mobile personalization trends.
- Africa’s Android dominance at 86.6% boosts demand for lightweight launchers on low-spec devices.
- The Middle East sees strong Nova Launcher interest, ranking #39 in the UAE.
- India drives APAC installs with 300k monthly downloads for popular launchers like Nova.
- Global fragmentation sees Android 15 at 17-27% adoption, impacting launcher compatibility regionally.
Daily and monthly activity rates for Android Launcher engagement
- Android launchers that offer deep personalization can reach DAU/MAU stickiness of 25–30%, compared with sub‑20% for minimal, utility‑only launchers.
- In high‑retention personalization segments, average DAU per launcher often exceeds 50–100k users, while less customizable launchers struggle to sustain tens of thousands of daily users over time.
- Mobile apps with strong return behavior typically show MAU that is 3–5x DAU, and highly engaging Android launchers often sit at the upper end of this range due to repeat customization visits.
- Apps with AI‑driven recommendations can improve engagement metrics by 20–60%, suggesting AI‑based app suggestions or smart shortcuts in launchers can significantly lift daily activity rates.
- Benchmarks for app “stickiness” classify DAU/MAU above 20% as engaging, and top‑performing, workflow‑centric launchers that integrate widgets and productivity tools can push closer to 30–40%.
- Across mobile apps, average day‑30 retention is often around 5–6% of original users, highlighting that simple launchers with few features tend to retain only a small fraction of monthly installers.
- General app benchmarks show 30‑day retention between 27–43% of active users, and context‑aware, utility‑rich experiences such as weather and calendar widgets help launchers sit near the higher end of this band.
- A stickiness rate of 20% (e.g., 2,000 DAU from 10,000 MAU) is considered solid, and power‑users who heavily customize UI often push launcher DAU/MAU ratios beyond this baseline.
Customization and personalization trends within Android Launchers
- Users increasingly value gesture support and adaptive layouts for home screens.
- Launchers with AI suggestions and smart sorting are rising in popularity.
- Minimalist launchers emphasize clean interfaces and simplicity.
- Many launches now support 5000+ themes and icon packs, enhancing personalization.
- Icon customization and drawer styles (vertical/horizontal) are common user requests.
- Widgets and productivity tools integration remains a key differentiator.
- Personalized launchers often outperform generic ones in engagement metrics.
- Users increasingly seek privacy‑friendly customization with minimal data tracking.
Battery and performance effects of Android Launcher usage
- Nova Launcher uses 100-150MB RAM on average, contributing to 1-2% hourly battery drain.
- Smart Launcher 6 consumes 60-100MB of RAM with only 0.7-1.3% battery drain per hour.
- Lawnchair 2 averages 80-120MB RAM usage and 0.8-1.5% hourly battery impact.
- Microsoft Launcher draws 120-180MB of RAM, leading to 1.2-2.5% battery drain hourly.
- KISS Launcher maintains extremely low RAM under 100KB in size for minimal performance hit.
- Widgets can spike launcher RAM by up to 22MB each on high-res QHD devices.
- Third-party launchers match or beat stock in battery use when optimized properly.
- Stock launchers achieve 50% daily drain over 12-14 hours, outperforming heavy third-party ones.
- Screen brightness accounts for 30-50% total battery drain, amplified by launcher animations.
- Poorly optimized launchers cause noticeable idle drain, up to 20% overnight in extreme cases.
Security and privacy considerations in Android Launcher apps
- Research on Android apps shows 30% of widely used third‑party SDKs lack clear privacy policies, increasing concerns about hidden data access in launcher components.
- Studies find that around 37% of popular SDKs over‑collect user data compared with their documented needs, contradicting claims of minimal access.
- One large‑scale analysis detected privacy‑relevant user reviews in over 12 million Google Play entries, highlighting rising user concern about tracking and data misuse.
- Empirical work reports that up to 88% of SDK configurations misrepresent sensitive data access, raising compliance and transparency risks for launcher apps.
- Analyses of Android security tools show about 20% may resell user data and nearly 50% fail to detect malware reliably, undermining trust in bundled “security” features within launchers.
- Market reports note that by 2023, a significant share of leading Android launchers had introduced enhanced privacy controls, reflecting growing demand for limited data collection.
- Google reports that millions of users engage daily with the Play Store’s Data Safety section before installing apps, signaling increased scrutiny of launcher permissions and SDK tracking.
- Measurements of Android permissions show the OS still exposes about 89% of potentially dangerous permissions to apps, giving launchers broad technical capability for data access if misused.
- Studies of the Android system and preinstalled apps show that continuous background telemetry can persist even after users opt out of tracking, intensifying fears of data exfiltration from app components.
- Evaluations of third‑party libraries find that a large proportion of apps keep default SDK privacy settings, often foregoing stricter options that would improve launcher security and transparency.
Forecasted growth and market expansion for Android Launchers
- The global Android Launcher market is estimated to be approximately $42.2 million in 2025.
- Multiple forecasts project a decline to ~$24.1 million by 2031 at a ‑7.8% CAGR.
- Some analysts note market contraction as native Android customization reduces third‑party demand.
- Alternative analysis suggests growth potential through AI and feature integration.
- Declining drivers include improved stock launchers and OS‑level personalization.
- Niche segments (privacy‑centric, minimalist) show resilience and steady interest.
- Expansion may occur in emerging markets with rising smartphone adoption.
- New device form factors (foldables) open avenues for launcher innovation.
Frequently Asked Questions (FAQs)
How large is the global Android Launcher market in 2025 (in USD)?
What is the projected CAGR for the Android Launcher market from 2025 to 2031?
How many Android users are there worldwide in 2025?
What percentage of global mobile devices run Android in 2025?
Which Android version leads in device share as of 2025, and what is its percentage?
Conclusion
Android launchers remain a specialized but active segment of the Android ecosystem. They offer personalization, workflow optimization, and UI innovation, yet face pressure from improved native interfaces and OS‑level features. While installation and retention metrics reflect broader mobile app behavior, launchers with advanced customization, smart tools, and privacy safeguards show stronger user engagement. Battery and security considerations influence long‑term adoption patterns.
Market forecasts present a nuanced picture; overall revenue may contract through 2031, but growth pockets exist where launchers evolve to meet distinct user needs. As Android devices diversify and UI expectations rise, the launcher space will continue adapting to balance performance, personalization, and privacy.

Leave a comment
Have something to say about this article? Add your comment and start the discussion.