



Subscription fatigue has become a major consumer behaviour trend as people juggle streaming platforms, SaaS tools, gaming memberships, meal kits, cloud storage plans, and AI subscriptions. Rising prices, overlapping services, and recurring billing models now push many households to reassess what they actually use each month. Businesses across the entertainment, fintech, and software industries are already changing pricing strategies to reduce cancellations and improve retention. Explore the latest subscription fatigue statistics, spending trends, and consumer insights shaping the subscription economy.
Editor’s Choice
- 52% of consumers cancelled at least one subscription during the past year in 2026.
- The average American now spends more than $300 per month on subscriptions and memberships.
- 47% of consumers say they actively cancelled at least one subscription service in 2026 due to fatigue or rising costs.
- Streaming subscribers in the US maintain an average of 2.9 paid streaming services.
- 63% of US consumers report feeling overwhelmed by the growing number of streaming choices.
- About 44% of consumers cancel subscriptions after a price increase.
- One-third of streaming subscribers cancelled at least one service because of subscription fatigue in 2025 and 2026.
- Average monthly subscription business churn rates now range between 5% and 7% globally.
- Nearly 74% of consumers admit recurring subscription charges are easy to forget.
Recent Developments
- Streaming companies increasingly push ad-supported subscription tiers as consumers seek lower monthly costs.
- In a 2026 survey, 36% of streaming users said they would accept twice as many ads to lower subscription fees.
- Younger audiences show stronger acceptance of ad-supported models, with 49% of Gen Z willing to watch more ads for cheaper plans.
- Subscription management platforms such as Rocket Money and Yorba gained popularity as users searched for hidden or forgotten recurring charges.
- AI subscriptions emerged as a new fatigue driver in 2026 as consumers added premium AI assistants and productivity tools to existing monthly expenses.
- More subscription businesses now offer pause options, flexible billing, and annual discounts to reduce churn.
- Major streaming and media companies increasingly explore bundling partnerships to reduce consumer frustration from managing multiple services.
- Consumers now spend significant time deciding what content to watch, with one survey estimating 110 hours annually spent browsing streaming libraries.
- Subscription businesses increasingly rely on AI-driven personalisation and retention analytics to reduce customer cancellations in 2026.
What Is Subscription Fatigue?
- Subscription fatigue refers to the mental, financial, and emotional stress consumers experience when managing too many recurring payments and digital memberships.
- In 2026, subscription fatigue affects industries far beyond streaming, including SaaS, fitness apps, cloud storage, AI tools, food delivery memberships, and gaming platforms.
- A 2026 industry analysis found that 41% of consumers report actively experiencing subscription fatigue.
- Research published in 2025 showed that recurring subscription overload increasingly causes consumers to rotate services instead of maintaining long-term loyalty.
- Microsoft’s 2025 Work Trend Index revealed that the average employee receives 117 emails daily, contributing to digital overload connected to subscription fatigue.
- Consumers increasingly associate subscription fatigue with hidden fees, auto-renewals, and confusing cancellation processes.
- A growing number of users now prefer flexible “pay-as-you-go” or microtransaction models instead of recurring monthly commitments.
- Analysts estimate the global subscription economy will approach $1 trillion in market value by the end of 2026 despite rising cancellation rates.
- Subscription fatigue has shifted consumer priorities toward simplicity, transparent pricing, and bundled offerings that reduce account fragmentation.
Monthly Streaming Subscription Spending by Age
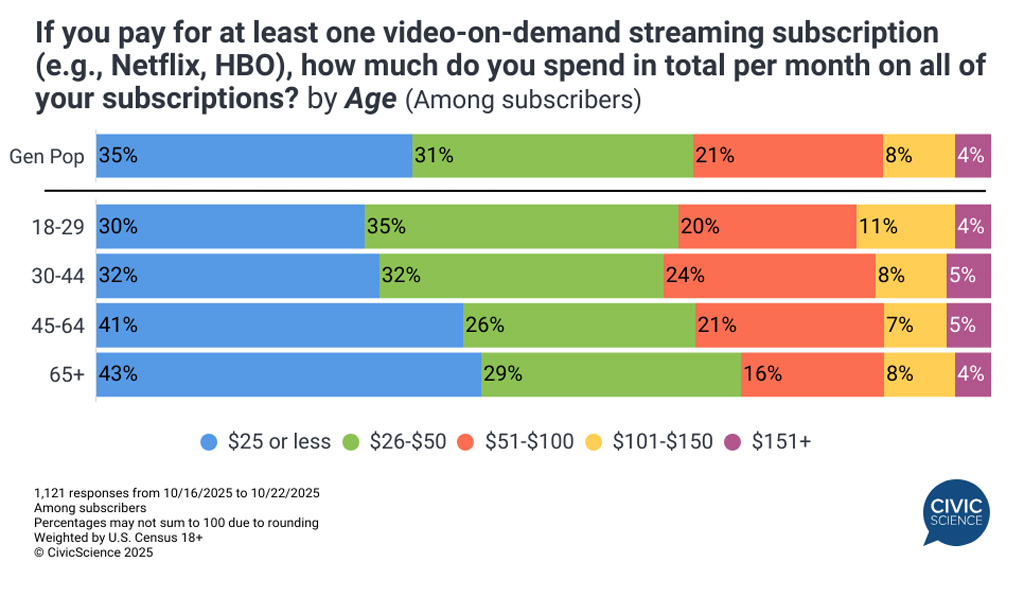
- Gen Pop viewers most commonly spend $25 or less per month, with 35% falling into this lowest spending bracket.
- Among all age groups, adults aged 65+ are the most likely to spend $25 or less, at 43%, showing lower monthly streaming costs among older subscribers.
- The 45–64 age group also leans toward lower spending, with 41% paying $25 or less per month.
- Younger adults aged 18–29 are more likely to spend in the $26–$50 range, with 35% choosing this bracket.
- The 30–44 age group shows the most balanced mid-level spending, with 32% spending $25 or less and another 32% spending $26–$50.
- Higher monthly spending is most visible among adults aged 30–44, where 24% spend $51–$100 per month on streaming subscriptions.
- Spending above $100 per month remains relatively low across all groups, ranging from 11% to 16% when combining the $101–$150 and $151+ brackets.
- Adults aged 18–29 have the highest share, spending $101–$150, at 11%, compared with 8% among the general population.
- The $151+ spending category is small across every age group, staying between 4% and 5%.
- Overall, the data suggests that most video-on-demand subscribers keep monthly streaming costs under $50, especially older age groups.
Key Subscription Fatigue Statistics
- 41% of consumers globally report feeling overwhelmed by the number of subscriptions they manage.
- Consumers now hold more recurring subscriptions across entertainment, software, fitness, shopping, and AI categories than at any previous point.
- Subscription economy growth between 2022 and 2026 is projected to reach 68%.
- Around 77% of consumers plan to maintain or reduce subscription counts in 2026 instead of adding new services.
- Subscription-related cancellations surged as inflation and digital service prices increased across 2025 and 2026.
- More than 60% of total subscription churn now comes from voluntary cancellations rather than failed payments.
- Nearly 29% of consumers say they accidentally subscribed to at least one service.
- The average subscription business sees a customer retention rate near 72% annually.
- SaaS companies collectively lose an estimated $1.6 billion annually from involuntary churn linked to failed payments and expired cards.
- Streaming fatigue continues to grow as more households rotate subscriptions month to month instead of staying loyal year-round.
How Common Is Subscription Fatigue Among Consumers?
- A 2026 study showed that 47% of consumers believe they pay too much for streaming services they rarely use.
- CivicScience research found that 41% of streaming subscribers cancelled at least one service due to subscription fatigue.
- About 63% of consumers report feeling overwhelmed by too many streaming options and content libraries.
- Gen Z consumers report some of the highest fatigue levels despite subscribing to multiple entertainment services simultaneously.
- 37% of Gen Z streaming users cancelled at least one subscription because they felt overwhelmed.
- Around 29% of Gen Z consumers planned to cancel another service soon because of subscription overload.
- A 2025 survey found that 74% of cord-cutters dropped at least one streaming service during the year.
- Consumers increasingly rotate subscriptions based on content availability instead of keeping year-round memberships.
- Many users underestimate how much they spend monthly because recurring payments blend into automated billing systems.
- Experts note that subscription fatigue now affects both high-income and budget-conscious households because the issue combines financial pressure with digital overload.
Subscription Cancellation Rates by Service Category
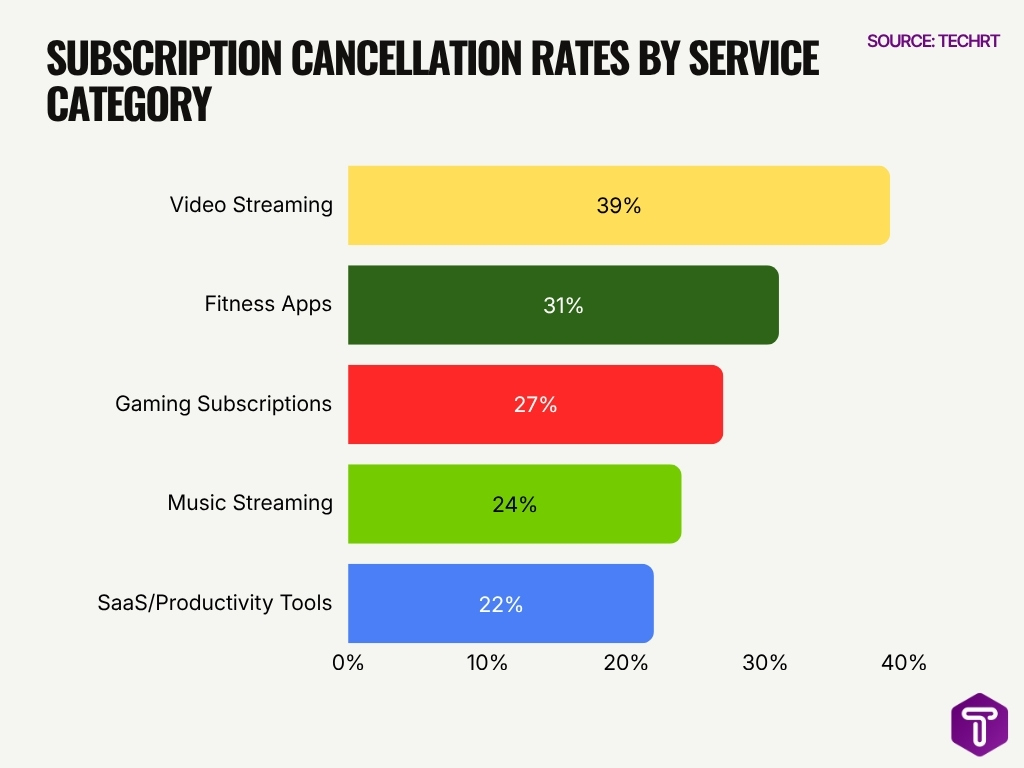
- Video streaming has the highest cancellation rate at 39%, showing that consumers are most likely to cut back on entertainment subscriptions when facing subscription fatigue.
- Fitness apps rank second with a 31% cancellation rate, suggesting that wellness-related subscriptions may struggle to retain users after initial trial or motivation periods.
- Gaming subscriptions recorded a 27% cancellation rate, indicating that users may cancel when they do not see enough ongoing value, new content, or regular engagement.
- Music streaming has a lower cancellation rate of 24%, which may suggest stronger daily-use habits compared with some other subscription categories.
- SaaS/Productivity tools have the lowest cancellation rate at 22%, showing that work-related or utility-based subscriptions may be more resilient because they serve practical needs.
- The gap between the highest and lowest cancellation categories is 17 percentage points, from 39% for video streaming to 22% for SaaS/Productivity tools.
- Overall, the data shows that entertainment and lifestyle subscriptions face a higher cancellation risk, while productivity-focused tools appear to have stronger retention.
How Many Subscriptions Does the Average Person Have
- The average US consumer manages between 6 and 9 active subscriptions in 2026, depending on age and income level.
- Millennials report the highest subscription ownership, averaging nearly 10 recurring services per person.
- Consumers under 35 are more likely to combine streaming, gaming, AI, music, and cloud storage subscriptions simultaneously.
- Streaming households in the US maintain an average of 2.9 paid video streaming subscriptions at one time.
- Approximately 31% of consumers admit they lost track of at least one active subscription in 2026.
- Subscription stacking became more common during major entertainment releases and sports events, causing temporary spikes in active memberships.
- Nearly 45% of consumers say they plan to reduce the number of subscriptions they maintain over the next 12 months.
- High-income households typically maintain more software and premium entertainment subscriptions than lower-income households.
- AI subscription adoption rose significantly in 2026, adding another recurring expense category for professionals and students.
- Consumers increasingly rotate entertainment subscriptions month by month instead of keeping all services active year-round.
Daily Use Is the Biggest Reason People Stay Subscribed
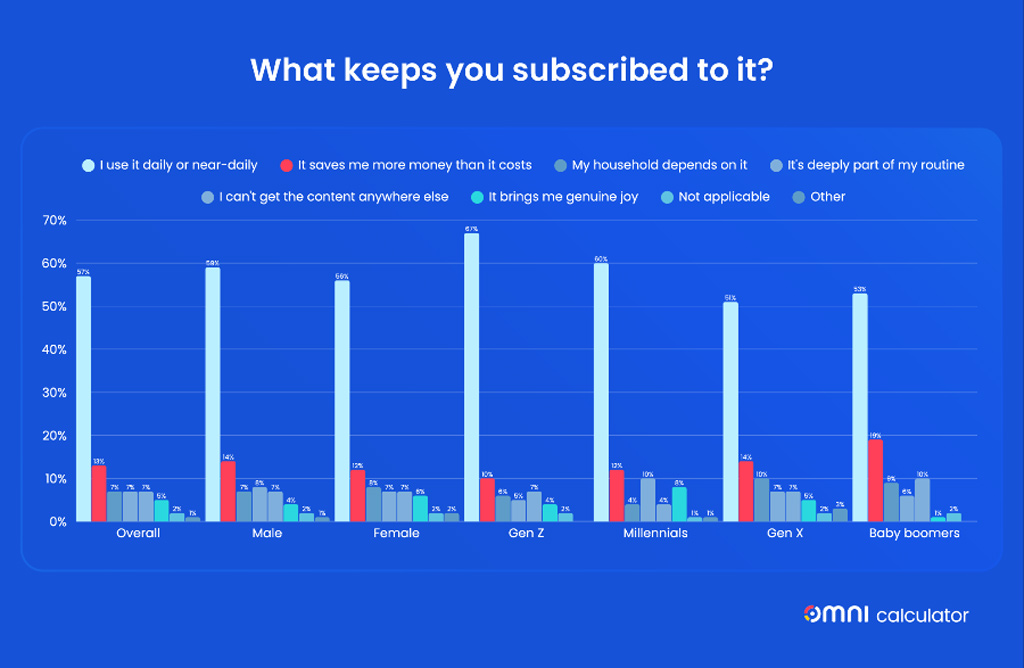
- Daily or near-daily use is the top reason people stay subscribed, selected by 57% of overall respondents.
- Gen Z shows the strongest usage-based loyalty, with 67% saying they stay subscribed because they use the service daily or almost daily.
- Millennials and males also report high daily-use dependence, both at 60%.
- Females follow closely, with 56% citing regular use as the main reason for keeping a subscription.
- Baby boomers are slightly less driven by daily use, but it still remains their leading reason at 53%.
- Gen X records the lowest daily-use figure among age groups at 51%, though it is still the dominant subscription-retention factor.
- Cost savings are the second-most common reason overall, but much lower than usage, with only 13% saying the subscription saves more money than it costs.
- Baby boomers are the most value-conscious group, with 19% staying subscribed because it saves them money.
- Gen X follows at 14%, while Millennials report 13% and Gen Z just 10% for cost-saving reasons.
- Household dependency is most important for Gen X, where 10% say their household depends on the subscription.
- Routine also plays a role, especially among Millennials, with 10% saying the subscription is deeply part of their routine.
- Access to exclusive content is a stronger motivator for Baby Boomers, with 10% saying they cannot get the content anywhere else.
- Emotional satisfaction is relatively low overall, with only 6% saying the subscription brings them genuine joy.
- Millennials are the most likely to stay subscribed for joy, at 8%, compared with only 1% of Baby Boomers.
- The data suggests that subscriptions are retained mainly because they are frequently used, not because they are emotionally loved or hard to replace.
Subscription Fatigue by Country and Region
- US consumers average $219–$273 monthly subscription spending in 2026.
- 47% of consumers cancelled at least one subscription in 2026, up from 31% in 2024.
- 41% of consumers worldwide report experiencing subscription fatigue.
- 39% of UK consumers are likely to cancel a streaming service in the next 12 months.
- 28% of European consumers intend to increase video subscriptions despite inflation.
- 60% of streaming subscribers would cancel after a $5 price hike.
- 53% of Canadians cancelled streaming subscriptions to save money amid rising costs.
- 71% of Latin American pay-TV users are open to ad-supported streaming models.
- 63% of Gen Z in developing markets share subscriptions with family or friends.
- Nordic households average 750€ monthly on subscriptions with high digital adoption.
Streaming Subscription Fatigue Statistics and Trends
- US streaming households maintain an average of 2.9 paid streaming services in 2026.
- Nearly 63% of streaming users say there are too many entertainment platforms available today.
- Around 41% of streaming subscribers cancelled at least one service because of fatigue or cost concerns.
- Ad-supported streaming plans gained significant traction in 2026 as consumers looked for cheaper alternatives.
- 36% of consumers said they would tolerate twice as many ads for lower monthly streaming prices.
- Streaming viewers spend approximately 110 hours per year browsing content libraries without choosing what to watch.
- Consumers increasingly subscribe temporarily during major sports seasons or exclusive content launches.
- Streaming bundles between telecom providers and entertainment platforms became more common in 2026.
- Password-sharing crackdowns pushed some consumers to cancel subscriptions instead of upgrading to family plans.
- Streaming churn rates increased throughout 2025 and 2026 as households reassessed recurring entertainment costs amid inflation.
Streaming Video Churn Is Highest Among Younger Consumers
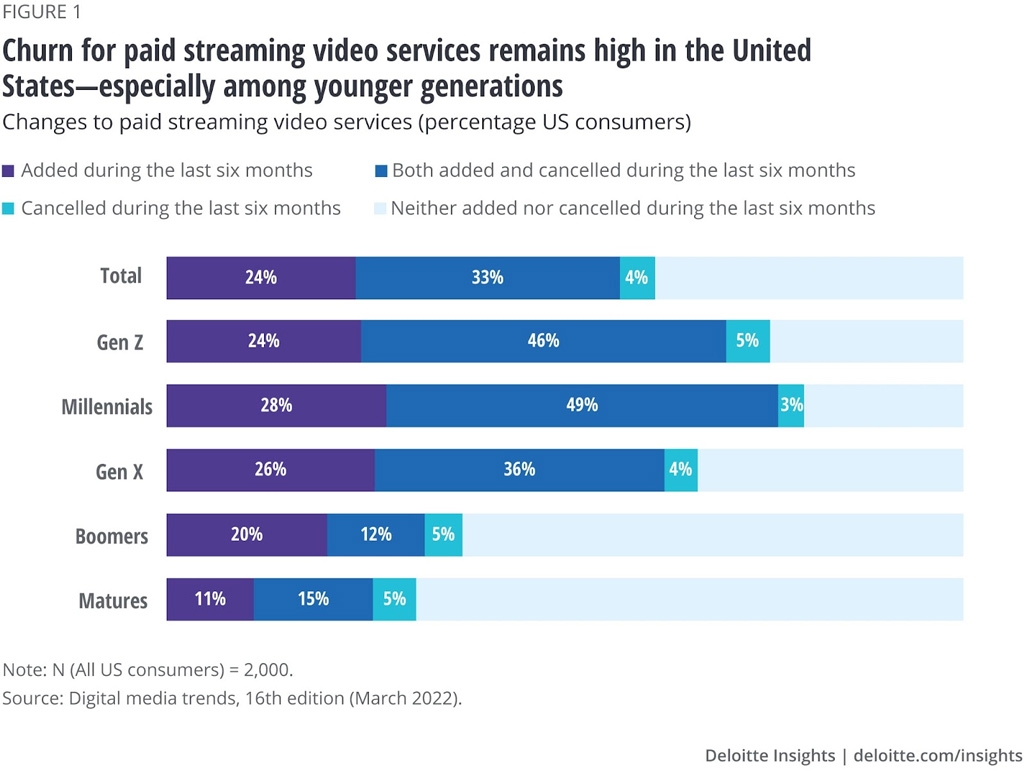
- Paid streaming video churn remains high in the US, with 33% of consumers saying they both added and cancelled a service in the last six months.
- Only 39% of total consumers reported making no changes to their paid streaming subscriptions, showing that subscription behaviour is highly active.
- Millennials show the highest churn activity, with 49% both adding and cancelling paid streaming services within six months.
- Gen Z follows closely, with 46% both adding and cancelling streaming services, highlighting strong switching behaviour among younger viewers.
- Gen X consumers also show notable movement, with 36% both adding and cancelling services during the same period.
- Older generations are more stable in their streaming habits, as 63% of Boomers and 69% of Matures neither added nor cancelled services.
- Millennials were the most likely to add new services, with 28% adding paid streaming subscriptions in the last six months.
- Matures were the least likely to add services, with only 11% subscribing to a new paid streaming video service.
- Standalone cancellations were relatively low across all age groups, ranging from 3% to 5%, suggesting many users are replacing services rather than simply cutting back.
- The data suggests that younger generations are driving streaming churn, while older consumers tend to maintain more consistent subscription habits.
SaaS and Software Subscription Fatigue Statistics
- Businesses now use an average of 112 SaaS applications across departments in 2026, increasing software management complexity.
- Nearly 53% of companies report paying for duplicate or underused SaaS subscriptions.
- SaaS spending continues to rise globally, with enterprise subscription software budgets increasing by approximately 12% year over year in 2026.
- Around 47% of IT leaders say subscription sprawl has become a major operational challenge.
- Companies increasingly consolidate software vendors to reduce recurring costs and simplify workflows.
- Failed payments and expired corporate cards contribute to billions in involuntary SaaS churn annually.
- AI software subscriptions became one of the fastest-growing SaaS categories between 2025 and 2026.
- About 39% of businesses now actively audit SaaS subscriptions every quarter to eliminate waste.
- Software buyers increasingly prefer usage-based pricing over fixed monthly subscriptions.
- SaaS churn rates remain highest among small businesses because of tighter operational budgets and overlapping software tools.
Financial Impact of Subscription Fatigue on Consumers
- The average US consumer spends more than $3,200 annually on subscriptions in 2026.
- Consumers underestimate their recurring monthly expenses by approximately $86 to $133, depending on category mix.
- Around 58% of consumers say subscriptions now significantly impact discretionary spending decisions.
- Inflation continues to push consumers toward lower-cost ad-supported subscription plans.
- Forgotten subscriptions collectively cost consumers billions of dollars annually through unused recurring charges.
- Households increasingly rotate subscriptions month by month to manage entertainment costs more effectively.
- Nearly 45% of consumers plan to reduce subscription spending during the next year.
- AI and productivity software subscriptions added new recurring expenses for freelancers, students, and remote workers in 2026.
- Consumers increasingly seek bundled packages to reduce total monthly spending and payment fragmentation.
- Subscription fatigue contributes to more deliberate purchasing behaviour and stricter household budgeting decisions across the US market.
Key Reasons Behind Subscription Fatigue
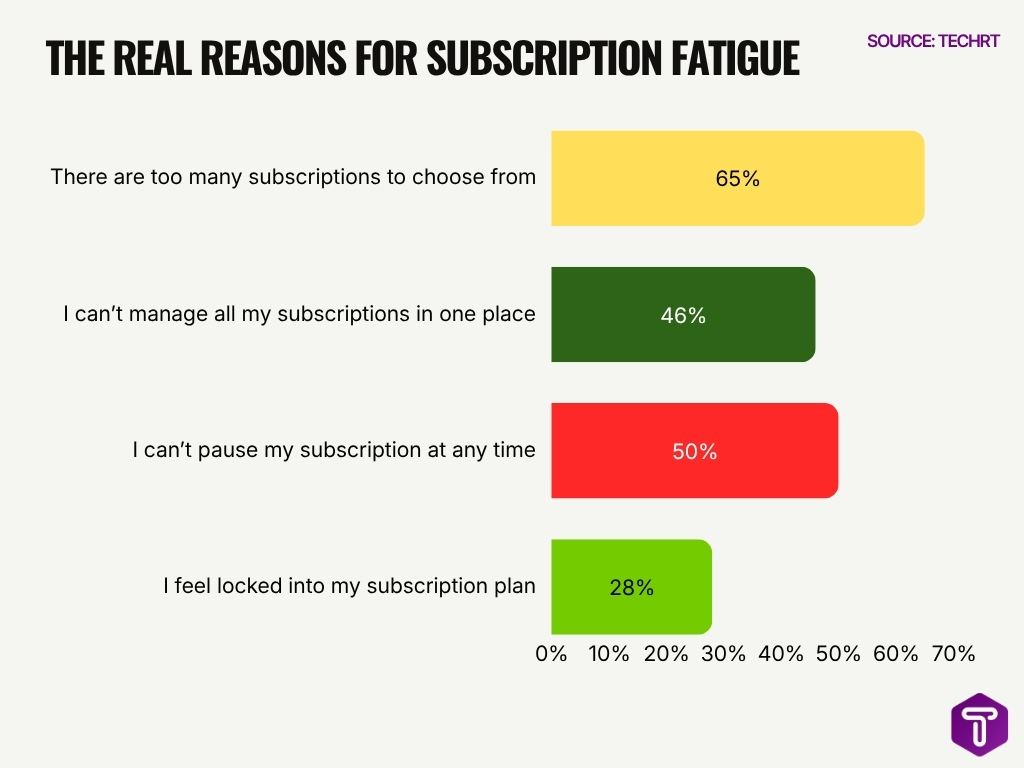
- Too many subscription choices are the biggest driver of subscription fatigue, with 65% of respondents saying there are too many subscriptions to choose from.
- 50% of users said they feel frustrated because they can’t pause their subscription at any time, showing that flexibility is a major concern.
- 46% of respondents said they can’t manage all their subscriptions in one place, highlighting the need for better subscription management tools.
- 28% of users said they feel locked into their subscription plan, which suggests that rigid plans can increase customer dissatisfaction.
- The data shows that subscription fatigue is not only about cost; it is also linked to choice overload, lack of control, and poor subscription flexibility.
- Brands can reduce fatigue by offering easy pausing options, centralised subscription controls, and more transparent plan terms.
- The leading issue, too many subscriptions to choose from at 65%, shows that consumers may feel overwhelmed before they even make a purchase decision.
Psychological and Behavioural Effects of Subscription Fatigue
- 41% of consumers report experiencing subscription fatigue in 2026.
- 87% of Gen Z streaming subscribers experience subscription fatigue.
- Consumers spend $219 monthly on an average of 8.2 active subscriptions.
- 74% of consumers find recurring subscription charges easy to forget.
- 47% of consumers cancelled at least one subscription in 2026.
- 28% of U.S. consumers find managing subscriptions overwhelming.
- 42% pay for subscriptions they no longer use.
- 60% of subscribers would cancel after a $5 price hike.
- 47% of streamers say they pay too much for SVOD services.
Forgotten Subscriptions, Free Trials, and Involuntary Churn Statistics
- Nearly 74% of consumers admit they forgot about at least one recurring subscription payment.
- Around 31% of users in 2026 report losing track of at least one active subscription.
- Approximately 48% of free trial users cancel before renewal due to automatic billing concerns.
- Failed payments account for nearly 20–40% of involuntary churn in SaaS and subscription businesses.
- SaaS companies lose an estimated $1.6 billion annually due to involuntary churn from failed payments.
- Over 45% of consumers have used subscription management apps to track hidden or forgotten charges.
- About 52% of users prefer virtual cards or temporary payment methods to control free-trial renewals.
- Businesses using automated billing recovery tools recover up to 30% of failed transactions.
- Nearly 41% of consumers cancel free trials early due to complex or unclear cancellation processes.
- Forgotten subscriptions cost the average consumer around $133 per year in unused digital services.
Key Platforms People Use Instead of Streaming
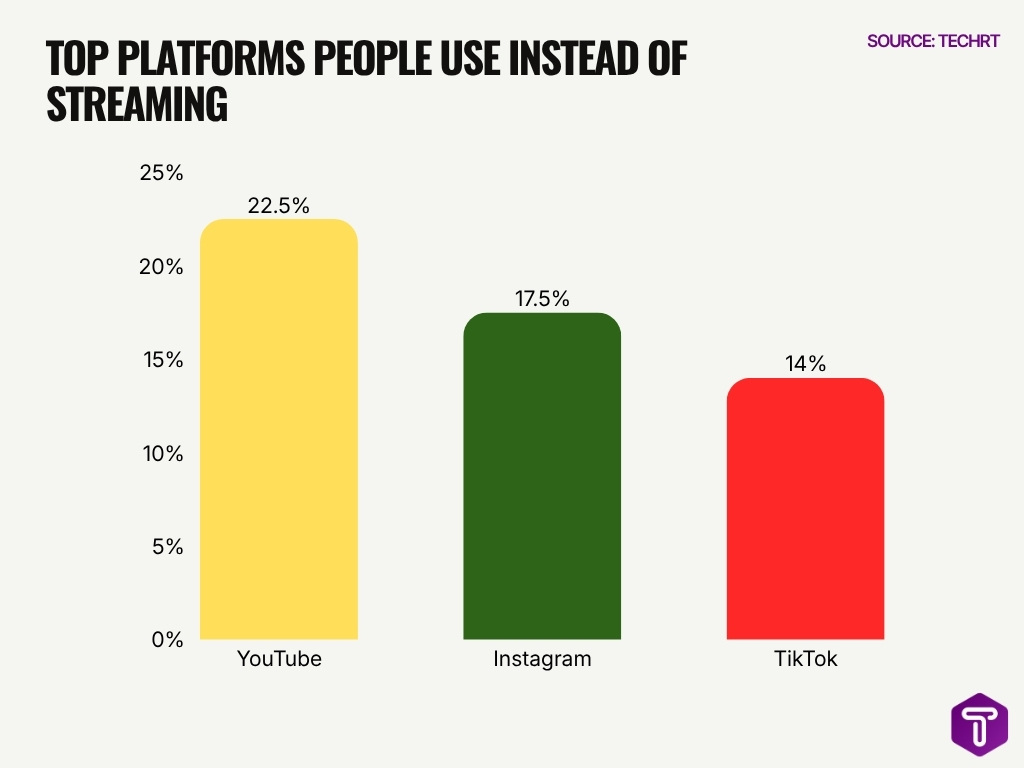
- YouTube is the leading alternative to streaming, used by 22.5% of people, making it the most preferred platform in this data.
- Instagram ranks second, with 17.5% of people using it instead of traditional streaming platforms.
- TikTok comes third, attracting 14% of users as a streaming alternative.
- The data shows that short-form and social video platforms are becoming strong competitors to streaming services.
- YouTube leads Instagram by 5 percentage points, showing its stronger role as a video entertainment substitute.
- Instagram is ahead of TikTok by 3.5 percentage points, suggesting that it still holds a slightly larger share among users looking beyond streaming.
- Together, YouTube, Instagram, and TikTok show that users are increasingly turning to free, flexible, and algorithm-driven content platforms instead of paid streaming services.
How Companies Are Responding to Subscription Fatigue
- Streaming services saw 71% of net new SVOD subscribers from ad-supported plans over nine quarters.
- 58% of consumers paused subscriptions instead of cancelling in the past year.
- Bundled subscribers average 6.2 subscriptions, an 82% lift over direct subscribers.
- 74% of SaaS suppliers adopted usage-based pricing models by 2026.
- Companies using AI for retention achieved 10-30% churn reductions.
- 82% of consumers are more likely to subscribe with easy cancellation.
- 75% of paused subscribers eventually return to active status.
- 46% of US streaming subscribers now choose ad-supported tiers.
- 51.7% customer retention from offering pause options.
Frequently Asked Questions (FAQs)
What percentage of consumers experience subscription fatigue in 2026?
How much do Americans spend on subscriptions each month in 2026?
What percentage of consumers cancelled a subscription service in 2026?
What is the average monthly churn rate for subscription services in 2026?
How many streaming users report subscription fatigue in 2026?
Conclusion
Subscription fatigue has evolved into one of the defining consumer behaviour trends. As households and businesses manage growing numbers of recurring payments across streaming, SaaS, gaming, AI tools, and digital services, consumers increasingly prioritise flexibility, transparency, and value. Rising prices, fragmented content ecosystems, and overlapping software subscriptions continue to drive cancellations and churn across industries.
At the same time, companies are adapting through ad-supported pricing, bundled offerings, personalised retention strategies, pause options, and usage-based billing models. The data shows that subscription fatigue is no longer limited to entertainment platforms alone; it now affects nearly every corner of the digital economy. Businesses that simplify pricing, improve customer trust, and reduce subscription complexity will likely maintain stronger retention and long-term growth in the years ahead.

Leave a comment
Have something to say about this article? Add your comment and start the discussion.