




The circular economy continues to reshape how businesses manage materials, reduce waste, and improve long-term profitability. Companies across manufacturing, retail, construction, and consumer packaging now invest heavily in recycling systems, product reuse, remanufacturing, and sustainable sourcing to cut costs and meet climate targets. Governments are also tightening regulations around waste, emissions, and resource efficiency, pushing industries toward more circular business models.
In practical terms, circular economy strategies already influence electric vehicle battery recovery, reusable packaging systems, textile recycling, and industrial material recovery programs. As resource prices rise and waste volumes accelerate, circularity has become both an environmental and economic priority. The statistics below reveal how quickly the global transition is evolving and where the biggest opportunities now exist.
Editor’s Choice
- The global circularity rate declined to 6.9% in 2025, down from 9.1% in 2018, showing that most materials entering the global economy still come from virgin resources.
- The world consumed roughly 106 billion tonnes of materials annually in 2025, while only a small fraction returned to the economy through recycled inputs.
- Global municipal solid waste generation reached approximately 2.1 billion tonnes in 2023 and could increase to 3.8 billion tonnes by 2050 without intervention.
- The worldwide waste management market reached an estimated $1.49 trillion in 2025 and is forecast to surpass $2.36 trillion by 2033.
- Resource extraction and processing account for at least 55% of global greenhouse gas emissions, making circularity a major climate strategy.
- Global e-waste volumes are expected to hit 82 million tonnes by 2030, while only 22.3% of e-waste generated in 2022 was formally recycled.
- Recyclables currently help avoid more than 700 million tonnes of CO2 emissions annually worldwide.
Recent Developments
- In 2025, global recycling rates declined for the eighth consecutive year, highlighting growing pressure on waste infrastructure and material systems.
- The European Union expanded its circular economy regulations in 2024 by introducing stricter waste shipment rules aimed at reducing overseas waste dumping.
- Several governments now include circular economy initiatives in national climate strategies, although only 27% of countries currently integrate circularity into official climate commitments.
- Global recycled material use increased by roughly 200 million tonnes between 2018 and 2021, yet virgin material consumption grew even faster.
- New industrial policies across Europe and Asia increasingly prioritize battery recycling, textile recovery, and critical mineral reuse programs.
- Global waste management costs may nearly double to $640.3 billion annually by 2050 if current disposal practices continue.
- Asia-Pacific maintained leadership in several circular manufacturing sectors in 2025, supported by rapid industrial recycling investments and green manufacturing programs.
- Circular economy financing expanded significantly in 2025 as sustainability-linked investments increasingly targeted recycling infrastructure and secondary materials markets.
- The global discussion around circularity intensified ahead of COP30, where resource efficiency and waste reduction became central climate negotiation themes.
Global Overview of the Circular Economy
- The circular economy focuses on extending product lifecycles through reuse, repair, remanufacturing, and recycling instead of the traditional “take-make-dispose” model.
- Global material extraction has nearly tripled over the past 50 years, increasing pressure on ecosystems and resource supplies.
- Current trends indicate global raw material demand could rise by 60% by 2060 if economies continue operating linearly.
- High-income countries consume resources at roughly six times the rate of low-income nations.
- Food systems, construction, manufactured goods, and transportation remain the four largest sectors influencing global circularity outcomes.
- Analysts estimate humanity could meet global consumption needs using only 70% of currently extracted materials through stronger circular systems.
- Circular business models increasingly generate revenue through leasing, product-as-a-service systems, refurbishment, and resale marketplaces.
- OECD countries generated an average of 552 kg of municipal waste per person in 2023, significantly above the global average.
- Governments worldwide continue introducing policies targeting plastic reduction, electronic waste collection, and industrial recycling mandates.
Global Circular Economy Market Size
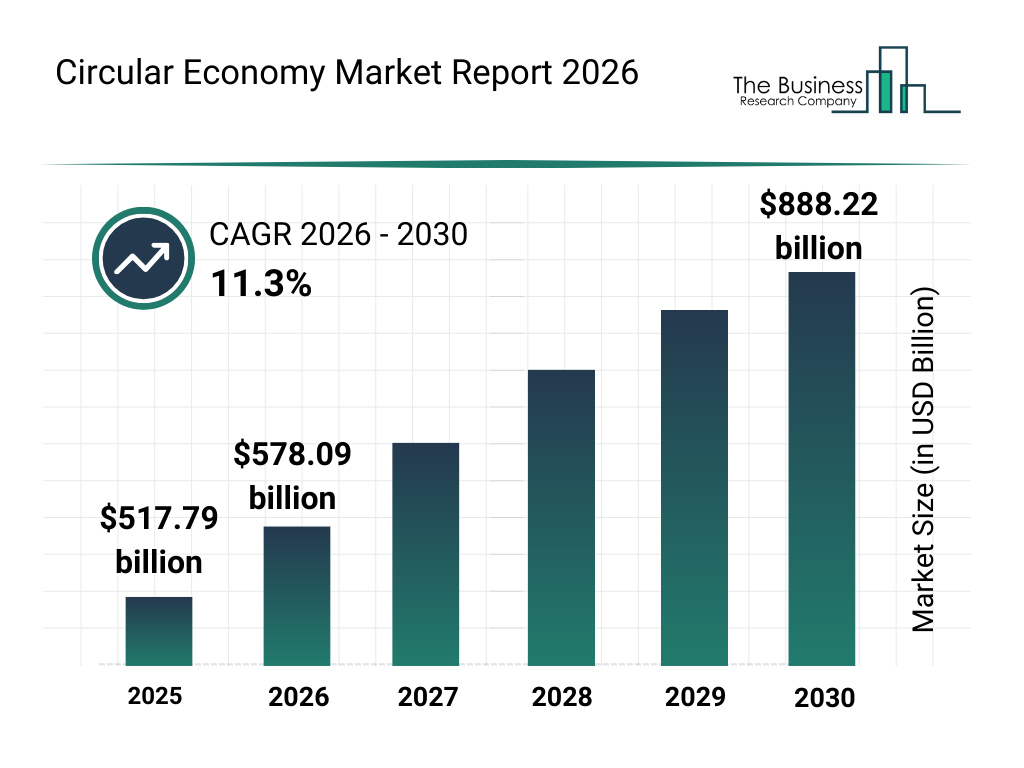
- The global circular economy market is estimated at $517.79 billion in 2025, showing a strong base for future growth.
- By 2026, the market is expected to increase to $578.09 billion, reflecting the rising adoption of circular business models.
- The circular economy market is projected to grow at a CAGR of 11.3% from 2026 to 2030.
- By 2030, the market size is forecast to reach $888.22 billion, highlighting major expansion opportunities across industries.
- From 2025 to 2030, the market is expected to grow by approximately $370.43 billion.
- The data shows that the circular economy market could increase by around 71.5% between 2025 and 2030.
- Growth is likely driven by a stronger focus on waste reduction, recycling, reuse, resource efficiency, and sustainable production.
- The steady year-on-year increase suggests that circular economy practices are becoming a mainstream business strategy, not just an environmental initiative.
Circular Economy Market Growth and CAGR
- The global circular economy market is forecast to grow at a compound annual growth rate of roughly 22% through 2030.
- Recycling technology investments accelerated in 2024 and 2025 as governments introduced incentives for advanced material recovery facilities.
- The global biodegradable packaging sector is projected to expand at a CAGR exceeding 6% through 2030.
- Circular textile markets continue to grow rapidly as resale, repair, and fiber recovery gain mainstream adoption.
- Analysts expect the lithium-ion battery recycling market to grow at more than 20% CAGR during the next decade.
- Global demand for recycled plastics rose sharply in 2025 due to corporate packaging commitments and regulatory mandates.
- Industrial symbiosis programs expanded across Asia-Pacific manufacturing hubs between 2023 and 2025.
- Green procurement programs increasingly require suppliers to disclose recycled content and material recovery metrics.
- Circular construction markets grew steadily due to rising demand for low-carbon building materials and adaptive reuse projects.
Key Circular Economy Definitions and Concepts
- A circular economy aims to eliminate waste by keeping products and materials in continuous use through recovery and regeneration systems.
- “Circularity rate” measures the percentage of secondary or recycled materials re-entering economic systems after use.
- “Linear economy” refers to the conventional economic model that relies on extracting raw materials, manufacturing products, and discarding waste after use.
- “Secondary materials” refer to recovered resources such as recycled plastics, metals, paper, textiles, and construction materials.
- Remanufacturing restores used products to like-new condition while preserving much of the original material value.
- Product life extension strategies, such as repair and refurbishment, reduce the need for virgin material extraction.
- Industrial symbiosis allows companies to use another organization’s waste stream as a manufacturing input.
- Closed-loop systems aim to recover products after use and return them directly into production cycles.
- Circular supply chains increasingly depend on digital tracking technologies, including AI sorting systems and material passports.
Global Circularity Rate Decline Highlights
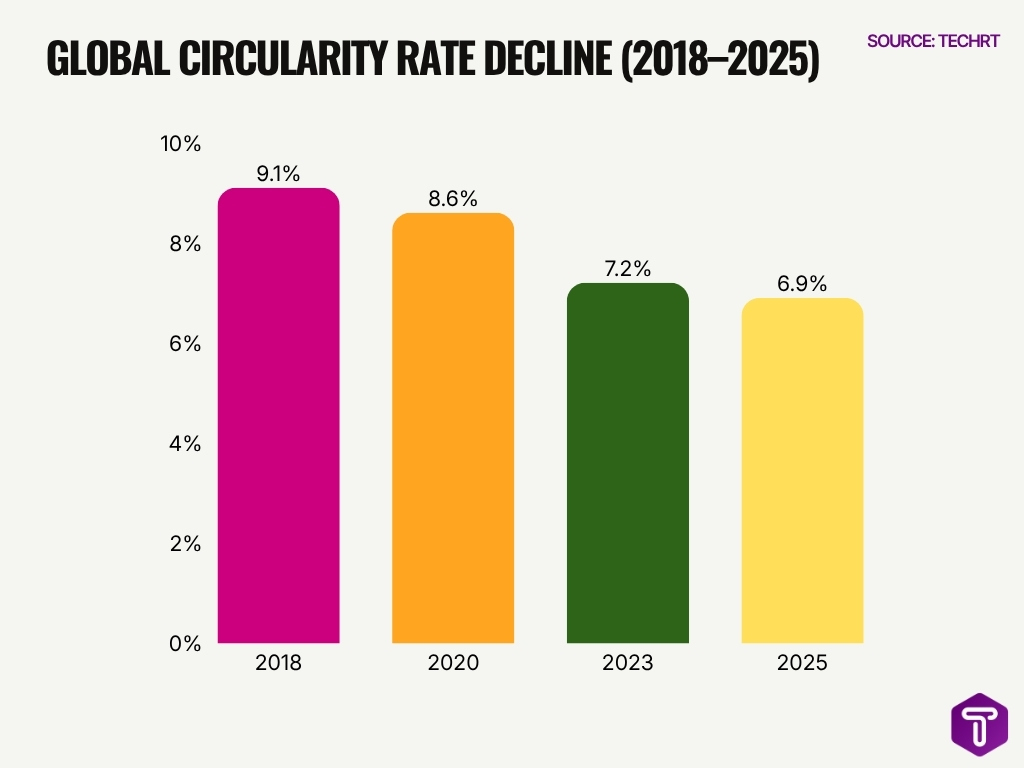
- The global circularity rate declined from 9.1% in 2018 to 6.9% in 2025, showing a clear downward trend.
- Between 2018 and 2025, the circularity rate dropped by 2.2 percentage points.
- The highest circularity rate shown was 9.1% in 2018, while the lowest was 6.9% in 2025.
- From 2018 to 2020, the rate decreased slightly from 9.1% to 8.6%, a decline of 0.5 percentage points.
- The sharpest decline occurred between 2020 and 2023, when the rate fell from 8.6% to 7.2%, dropping by 1.4 percentage points.
- From 2023 to 2025, the rate declined more slowly, moving from 7.2% to 6.9%.
- The data suggests that the world is becoming less circular over time, meaning a smaller share of materials is being reused, recycled, or returned to the economy.
- By 2025, only 6.9% of global material use was circular, highlighting a major gap in global resource efficiency and sustainability efforts.
Economic Value Lost to Linear Practices
- Poor waste management practices generated an estimated $361 billion in global hidden costs linked to pollution, health impacts, and climate damage.
- Annual global waste management costs could rise to $640.3 billion by 2050 without major circular economy reforms.
- Less than one-quarter of global e-waste receives proper recycling treatment despite containing billions of dollars in recoverable materials.
- Unrecovered resources from improperly managed e-waste were valued at approximately $62 billion in 2022 alone.
- Global economies lose substantial value when products designed for short lifespans enter landfills instead of reuse systems.
- Food waste remains one of the largest inefficiencies in the linear economy, contributing heavily to landfill methane emissions.
- Analysts estimate many industries could lower raw material expenses significantly through remanufacturing and recycled inputs.
- Companies that adopt circular production models often reduce operational costs through lower material dependency and waste disposal expenses.
- Circular procurement systems increasingly help manufacturers stabilize costs during periods of commodity price volatility.
Regional Circular Economy Market Breakdown
- Europe leads with a 11.8% circular material use rate in 2023, and circular economy activities employed 4.3 million people across the region.
- The EU’s circular economy generated almost €147 billion in 2016, while recent estimates put annual financing needs at €55 billion.
- China’s resource recycling industry exceeded 4 trillion yuan in output in 2024 and supported more than 35 million jobs.
- In North America, the battery recycling market is projected to grow from $9.70 billion in 2025 to $15.27 billion by 2030.
- The Asia-Pacific region is seeing major manufacturing-waste recovery momentum, with China’s plastic recycling market projected to move from 22.56 million tonnes in 2024 to 45.58 million tonnes by 2035.
- The Middle East is scaling water reuse and desalination systems, including one regional investment brief that highlights roughly $115 billion in utility-concession and water-portfolio activity.
- Across Africa, informal recyclers in South Africa contribute about 40% of municipal recycling, while informal e-waste trade in Ghana has been valued at over $100 million annually.
- Latin America is expanding EPR, with the region’s e-waste management market reaching 4.80 million metric tons in 2024 and expected to hit 9.00 million metric tons by 2033.
- The Nordics remain strong on recovery performance, with household and similar waste material-recycling targets set at 70% by 2025 and 70% for packaging by 2030.
- Scandinavian recycling performance stays above the EU average in several markets, with Sweden reporting 395 kg/cap of municipal waste in 2022 and a recycling rate of 39.7% in 2022.
Circular Economy Adoption by Industry Sector
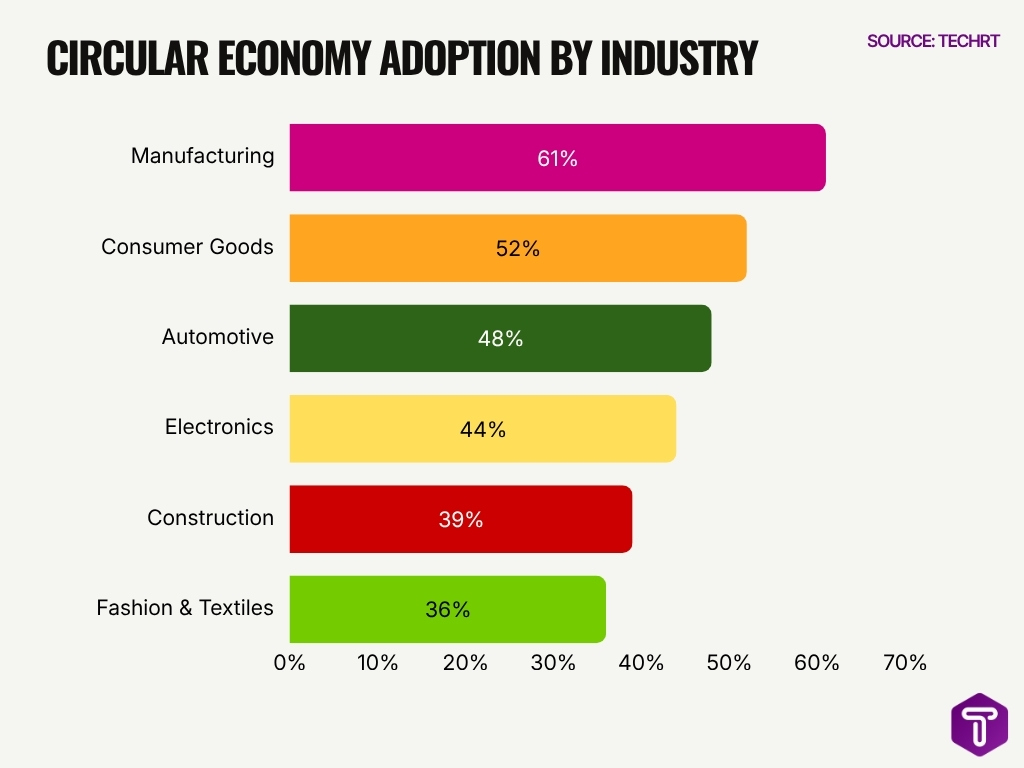
- Manufacturing leads circular economy adoption with 61%, making it the strongest industry in shifting toward circular practices.
- Consumer goods rank second at 52%, showing that brands are increasingly focusing on reuse, recycling, sustainable packaging, and resource efficiency.
- The automotive industry records 48% adoption, reflecting growing investment in remanufacturing, recycled materials, battery reuse, and closed-loop production.
- Electronics adoption stands at 44%, driven by e-waste recovery, repair programs, refurbished devices, and component recycling.
- Construction has a 39% adoption rate, indicating steady but slower progress in material reuse, waste reduction, and sustainable building practices.
- Fashion & textiles reports the lowest adoption among listed industries at 36%, highlighting ongoing challenges around textile waste, overproduction, and recycling infrastructure.
- The gap between the highest and lowest industries is 25 percentage points, from 61% in manufacturing to 36% in fashion & textiles.
- Overall, the data show that industrial and product-based sectors are adopting circular economy practices faster than sectors with complex waste streams and fragmented supply chains.
Investment and Financing in the Circular Economy
- Global sustainable investment assets surpassed $4.1 trillion in 2025, with circular‑economy‑linked deals accounting for roughly 2% of tracked capital.
- Circular‑economy businesses raised nearly $164 billion between 2018 and 2023, up from $10 billion in 2018 to $28 billion in 2023.
- Annual investment in circular business models surged by 87% from 2021 to 2023 versus 2018–2020, reflecting faster investor appetite.
- The European Investment Bank and partners have invested €5.1 billion in 153 circular‑economy projects between 2020 and 2024.
- Public circular‑finance initiatives such as the Joint‑Initiative on Circular Economy aim to mobilize €16 billion for circular projects by 2025.
- Global green bond issuance earmarked for resource efficiency, recycling, and waste management projects exceeded $200 billion cumulatively by 2025.
- Battery‑recycling startups attracted over $10 billion in venture capital and strategic funding between 2022 and 2025, driven by EV demand.
- Public‑private partnerships allocated more than $15 billion to circular urban‑waste infrastructure globally between 2019 and 2024.
- Resource‑efficiency and recycled‑content metrics now influence nearly 60% of institutional ESG‑aligned portfolios worldwide.
- Circular‑economy financing gaps in developing economies remain over $200 billion per year, despite global sustainability assets crossing $30 trillion.
Resource Extraction and Material Consumption Statistics
- Global material extraction surpassed 100 billion tonnes a year and has more than tripled since 1970.
- Biomass, fossil fuels, metal ores, and non-metallic minerals are the four largest extracted material groups worldwide.
- Roughly half of all materials excavated and manufactured globally are used for construction.
- High-income countries, while only 16% of the world’s population, are responsible for 74% of cumulative excess resource use.
- Global raw material extraction is projected to rise by about 60% by 2060 under current patterns.
- Only 6.9% of the 106 billion tonnes of materials used annually in the global economy come from recycled sources.
- Sand, gravel, and crushed stone dominate construction aggregates, with one large market showing over 1 billion metric tons of sand and gravel produced annually.
- Resource extraction and processing are linked to over 90% of biodiversity loss and water stress, and about half of global greenhouse gas emissions.
- Stronger circular systems could reduce reliance on virgin materials by billions of tonnes each year through higher recycled content and longer product lifetimes.
Resource Recovery Distribution in the Circular Economy
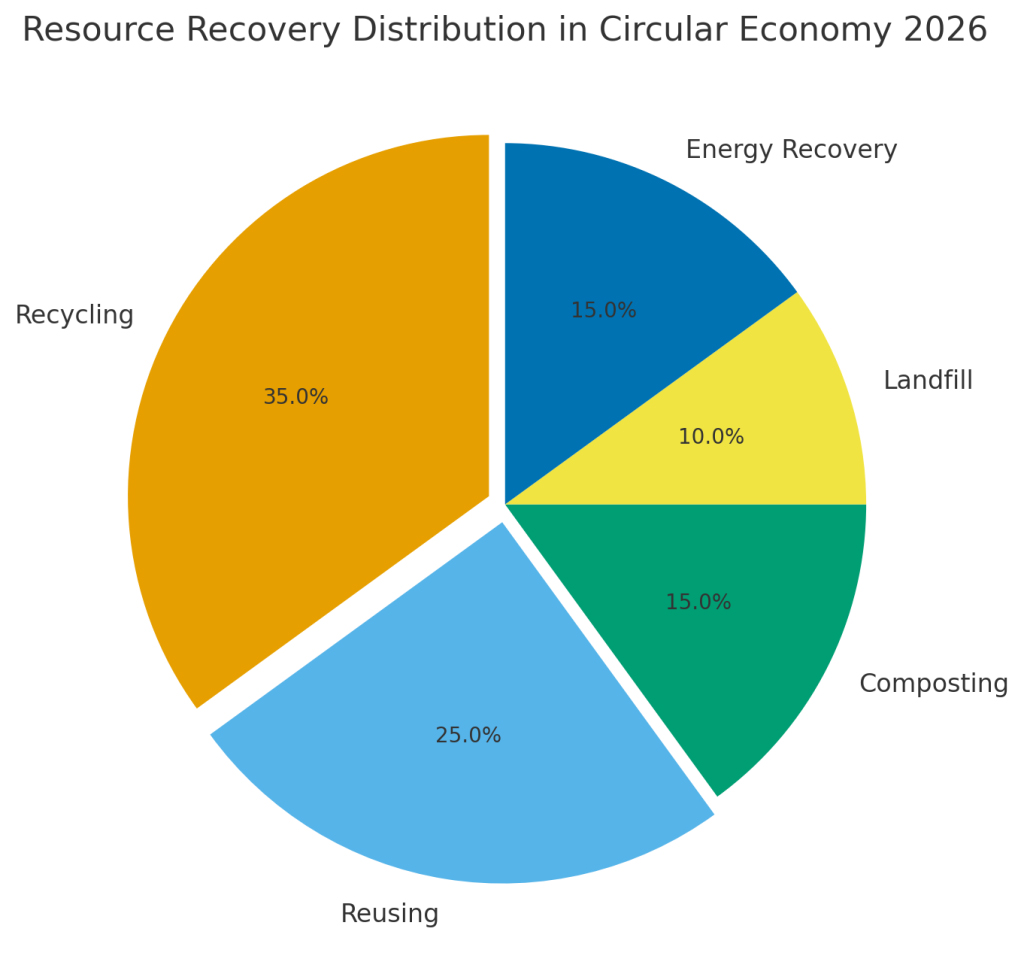
- Recycling holds the largest share in resource recovery, accounting for 35.0% of the total distribution.
- Reusing is the second-largest recovery method, contributing 25.0%, showing strong emphasis on extending product and material life.
- Together, Recycling and Reusing make up 60.0% of the total resource recovery distribution, highlighting the importance of material reuse in the circular economy.
- Composting represents 15.0% of the distribution, indicating a notable role for organic waste recovery.
- Energy Recovery also accounts for 15.0%, showing that waste-to-energy methods remain an important part of resource recovery strategies.
- Landfill has the smallest share at 10.0%, suggesting a lower reliance on disposal-based waste management.
- The data shows that circular economy practices prioritize recovery, reuse, and recycling over traditional landfill disposal.
- With only 10.0% going to Landfill, the chart indicates a shift toward more sustainable and resource-efficient waste management systems.
Global Waste Generation and Treatment Statistics
- 2.6 billion tonnes of municipal solid waste were generated worldwide in 2022, and this could reach 3.9 billion tonnes by 2050.
- Nearly one-third of global waste is still uncollected or openly dumped.
- Around 1.05 billion tonnes of food were wasted annually, with households responsible for 60% of it.
- Global plastic production reached about 415 million metric tons in 2023, while plastics have more than doubled since the start of the century.
- The world generated 62 million tonnes of e-waste in 2022, up from 34 million tonnes in 2010.
- Only 22.3% of global e-waste was formally collected and recycled in 2022.
- E-waste is growing by 2.6 million tonnes per year and is projected to hit 82 million tonnes by 2030.
- Asia generated over 30 million tonnes of e-waste in 2022, more than twice the amount from the Americas.
- Recycling still handles only about 21% of global waste through recycling, composting, and anaerobic digestion, while incineration treats another 20%.
- Recycling and waste treatment infrastructure remains uneven, with higher-capacity systems concentrated in high-income regions and much weaker coverage in low-income countries.
Circular Economy and Greenhouse Gas Emissions
- Resource extraction and processing contribute approximately 55% of global greenhouse gas emissions.
- Circular economy strategies could reduce global emissions by nearly 40% in key industrial sectors such as cement, steel, aluminum, and plastics.
- Food waste alone generates an estimated 8% to 10% of global greenhouse gas emissions annually.
- Recycling aluminum uses up to 95% less energy compared to producing primary aluminum from raw bauxite ore.
- Circular construction practices can significantly reduce embodied carbon emissions in buildings through material reuse and modular design.
- Extending product lifecycles by one additional year could lower carbon footprints across electronics, textiles, and appliances.
- Methane emissions from landfills remain a major climate challenge due to growing organic waste volumes worldwide.
- Recycled steel production generates substantially fewer emissions than virgin steel manufacturing processes.
- Circular supply chains increasingly help companies meet net-zero targets through lower material extraction and waste generation.
Recycling Rates by Material Type
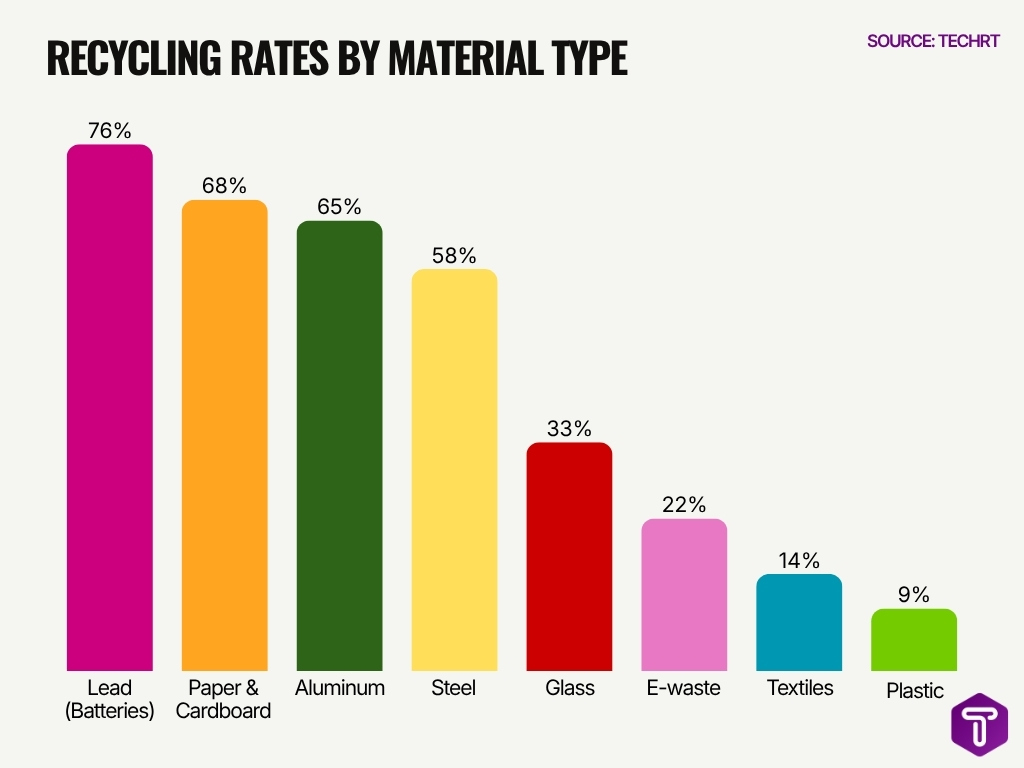
- Lead batteries have the highest global recycling rate at 76%, making them the most successfully recycled material type in the chart.
- Paper & cardboard follow closely with a strong recycling rate of 68%, showing that fiber-based materials remain among the easiest and most widely recovered.
- Aluminum also performs well, with a recycling rate of 65%, highlighting its high reuse value and strong recovery infrastructure.
- Steel records a recycling rate of 58%, placing it among the top-performing materials due to its durability and recyclability.
- Glass has a moderate recycling rate of 33%, indicating that while it is recyclable, collection and processing gaps still limit global recovery.
- E-waste recycling remains relatively low at 22%, despite containing valuable metals and components that can be recovered.
- Textiles show a weak recycling rate of only 14%, reflecting challenges in fabric sorting, blended materials, and limited recycling systems.
- Plastic has the lowest recycling rate at just 9%, making it one of the biggest challenges in the global circular economy.
- The data shows a major gap between the highest and lowest recycling rates, with lead batteries at 76% compared to plastic at 9%.
- Overall, materials with established collection systems and high economic value, such as lead batteries, paper, aluminum, and steel, achieve much higher recycling rates than plastic, textiles, and e-waste.
Employment and Job Creation in the Circular Economy
- 121–142 million people work in circular-economy activities worldwide, equal to 5–5.8% of global employment outside agriculture.
- Over 74 million circular-economy workers are in the informal economy, showing how much of this employment lacks protection and stable income.
- Asia-Pacific has about 77.6 million circular-economy jobs, making it the largest regional hub for this workforce.
- In the EU, circular-economy employment rose from 3.35 million people in 2005 to 4.28 million in 2021.
- EU circular-economy jobs grew by 420,724 between 2015 and 2021, and a major estimate projects 700,000 more jobs by 2030.
- Reuse-focused social enterprises create about 70 jobs per 1,000 tonnes collected for reuse, with a range of 20–140 jobs depending on the activity.
- Buried waste creates only about 1 local full-time job per tonne, while sorting and recycling can generate around 30 jobs per tonne.
- In India, at least 3 million waste workers are estimated to be active, and some studies suggest 1–2% of the population may be engaged in informal waste recycling.
- India’s circular economy is projected to create 14 million green jobs by 2030, including more than 1 million in e-waste recycling.
- Textile circularity in India could add around 100,000 jobs, while the sector already supports roughly 40–45 lakh people in collection and sorting.
Corporate Circularity Targets and Commitments
- 64% of Fortune 500 manufacturers now incorporate circular economy principles into core operations.
- 91% of companies by market capitalization disclosed sustainability-related information in 2024.
- The automotive sector invested $127 billion in circular initiatives since 2023.
- 67% cost savings achieved by businesses implementing circular economy strategies.
- The secondhand fashion market is valued at $210–220 billion and projected to reach $320–360 billion by 2030.
- Annual demand for recycled plastics reached $81.7 billion in 2025, up 7.9% from 2024.
- More than 55% of EV battery recycling capacity was added between 2023 and 2024.
- Circular business models could generate $1 trillion in material savings annually by 2030.
Top Circular Economy Investors
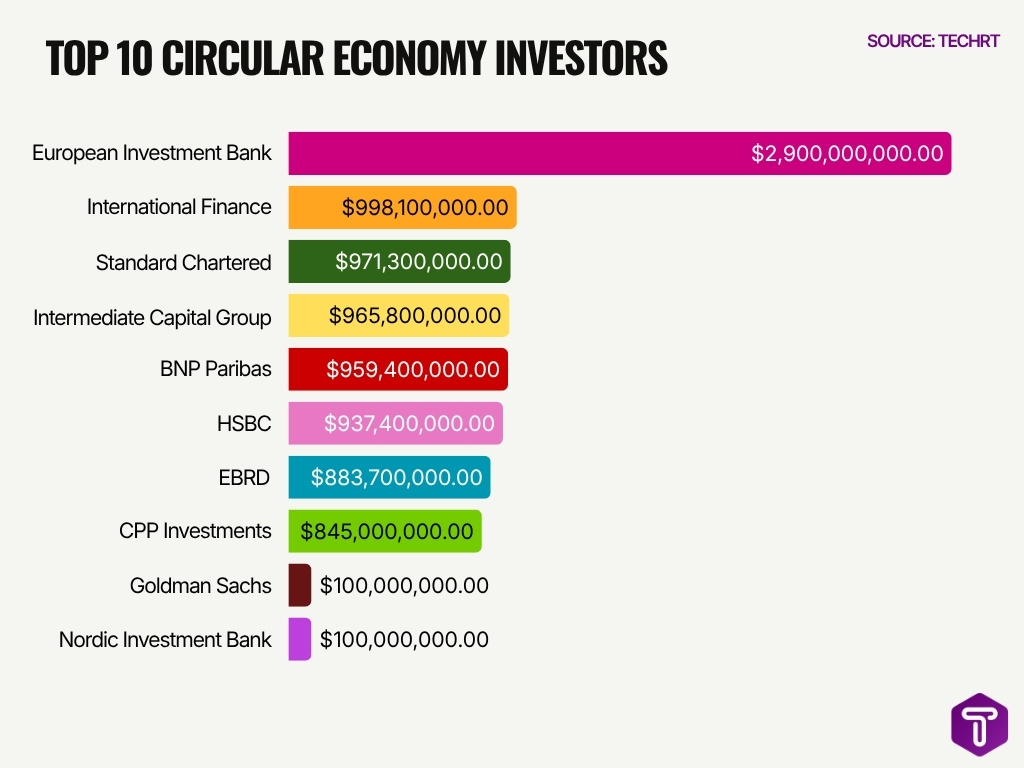
- European Investment Bank is the largest circular economy investor, with a total investment of $2.9 billion, far ahead of all other investors.
- The second-largest investor is International Finance, with $998.1 million invested in circular economy initiatives.
- Standard Chartered ranks third, contributing $971.3 million to circular economy-related investments.
- Several major financial institutions have invested close to the $1 billion mark, including Intermediate Capital Group ($965.8 million), BNP Paribas ($959.4 million), and HSBC ($937.4 million).
- The European Bank for Investment has invested $883.7 million, while CPP Investments follows with $845 million.
- Goldman Sachs and Nordic Investment Bank are tied at the lower end of the top 10 list, each investing $100 million.
- The data shows that European financial institutions play a major role in circular economy funding, with the European Investment Bank leading by a wide margin.
- There is a significant investment gap between the top investor and others, as the European Investment Bank’s $2.9 billion investment is nearly three times higher than that of the second-ranked investor.
- The top investors indicate strong participation from banks, investment groups, and institutional finance organizations in supporting circular economy growth.
- Overall, the chart highlights that circular economy financing is being driven largely by large-scale public and private financial institutions.
Packaging and Plastics in the Circular Economy
- Global plastic waste generation more than doubled from 156 million tonnes in 2000 to over 350 million tonnes in 2020.
- Packaging accounts for roughly 40% of total plastic consumption worldwide.
- Only around 9% of global plastic waste currently undergoes recycling treatment.
- Reusable packaging pilots expanded rapidly in food service, cosmetics, and grocery retail sectors during 2024 and 2025.
- Deposit return systems significantly improved beverage container recovery rates across Europe and North America.
- Compostable and biodegradable packaging markets continued expanding due to rising consumer demand and regulatory pressure.
- Several countries introduced taxes or restrictions targeting single-use plastics between 2023 and 2025.
- Flexible plastic packaging remains one of the hardest materials to recycle at scale due to its multi-layer material composition.
- Recycled-content mandates increasingly require manufacturers to include post-consumer plastics in packaging production.
Future Outlook for the Circular Economy Market
- The circular economy could unlock up to $4.5 trillion in economic growth by 2030 while creating more than 7 million jobs globally.
- The global circular economy market is valued at $638.57 billion in 2024 and projected to reach $2,204.39 billion by 2034 at a 13.20% CAGR.
- The circular economy solutions market was estimated at $2.7 trillion in 2024 and expected to grow at an 8.2% CAGR through 2034.
- Construction & built environment held the largest share at 26.4% of the circular economy solutions market in 2024, making it the fastest-adopting sector.
- The EV battery recycling market is projected to reach $15.58 billion by 2030, growing at a rapid 32.05% CAGR due to surging EV demand.
- The digital circular economy market will grow from $4.28 billion in 2025 to $11.89 billion by 2030 at a 22.67% CAGR.
- Electronics & electrical equipment held 20.1% market share in 2024, driven by increasing recycling and refurbishing adoption.
- The EU circular material use rate reached 11.8% in 2023, still far below the 2030 target of over 23%, showing major scaling potential.
Frequently Asked Questions (FAQs)
What is the global circularity rate in 2025?
2. How large is the global circular economy market?
What CAGR is forecast for the circular economy market?
How many materials does the global economy consume annually?
What share of global plastic waste gets recycled?
Conclusion
The circular economy has moved far beyond a sustainability trend and now plays a central role in global industrial strategy, climate policy, and resource security planning. Rising material costs, growing waste volumes, and stricter environmental regulations continue pushing businesses and governments toward more circular production and consumption systems.
The data also shows that major gaps remain. Global circularity rates continue to decline, recycling infrastructure remains uneven, and waste generation still outpaces recovery efforts in many regions. However, investment activity, technological innovation, and corporate sustainability commitments continue creating momentum across recycling, remanufacturing, reusable packaging, and resource recovery markets.
As industries shift toward low-waste operations and consumers demand more sustainable products, circular economy practices will likely shape the next decade of manufacturing, supply chain management, and climate action worldwide.

Leave a comment
Have something to say about this article? Add your comment and start the discussion.